
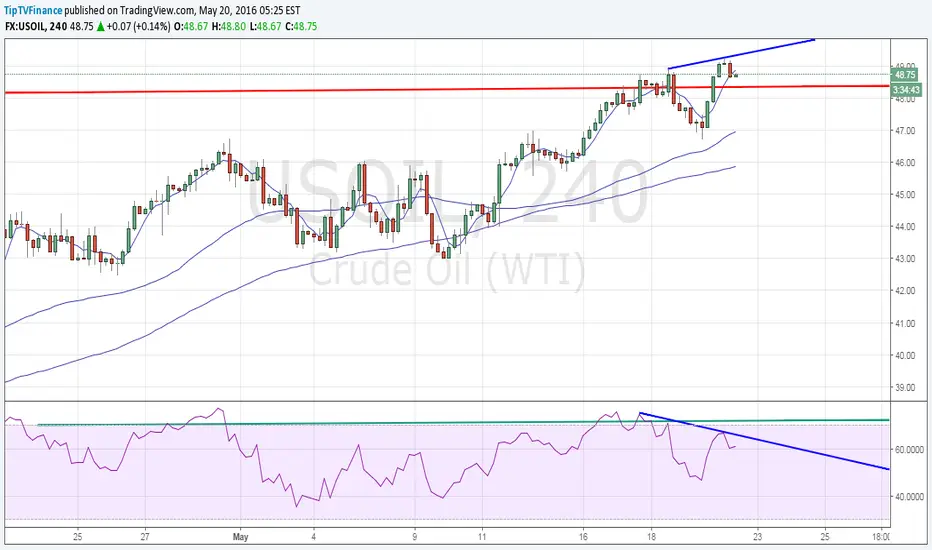
Prices hit a high of $49.14 before trimming gains to trade around $48.80 levels.
- 4-hour chart shows a bearish price RSI divergence.
- Also note, futures show a gap up opening today. The gap is between $48.22 and $48.82 levels.
- In the light of bearish price RSI divergence, prices appear likely to fill the gap ahead of NY closing.
- On a larger scheme of things, bullish invalidation is seen only if prices see a day end closing below Apr 29 high.

관련 발행물
면책사항
해당 정보와 게시물은 금융, 투자, 트레이딩 또는 기타 유형의 조언이나 권장 사항으로 간주되지 않으며, 트레이딩뷰에서 제공하거나 보증하는 것이 아닙니다. 자세한 내용은 이용 약관을 참조하세요.
관련 발행물
면책사항
해당 정보와 게시물은 금융, 투자, 트레이딩 또는 기타 유형의 조언이나 권장 사항으로 간주되지 않으며, 트레이딩뷰에서 제공하거나 보증하는 것이 아닙니다. 자세한 내용은 이용 약관을 참조하세요.