
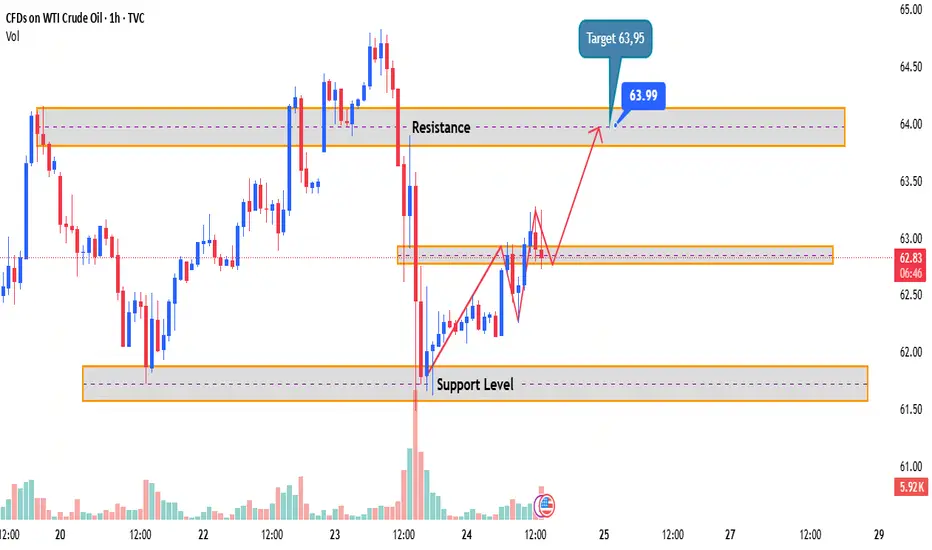
This chart for WTI Crude Oil presents a bullish continuation setup following a rebound from the support level around 61.50. After breaking above a minor consolidation range, price is now retracing slightly before potentially continuing its upward movement.
The chart highlights a target at63.95, just below the upper resistance zone, which previously acted as a strong supply area.
Technical Breakdown:
- Support Level: Firm bounce near 61.50, confirming demand.
- Minor Breakout: Price broke above local structure and retesting for continuation.
- Resistance Zone: Located near64.00, target aligns with historical supply.
- Next Target: 63.95
Volume spikes during the bounce suggest strong buyer interest. A clean break and hold above 63.00 could open the path toward the $63.95 target. Traders may look for bullish price action confirmation for entry.
The chart highlights a target at63.95, just below the upper resistance zone, which previously acted as a strong supply area.
Technical Breakdown:
- Support Level: Firm bounce near 61.50, confirming demand.
- Minor Breakout: Price broke above local structure and retesting for continuation.
- Resistance Zone: Located near64.00, target aligns with historical supply.
- Next Target: 63.95
Volume spikes during the bounce suggest strong buyer interest. A clean break and hold above 63.00 could open the path toward the $63.95 target. Traders may look for bullish price action confirmation for entry.

면책사항
해당 정보와 게시물은 금융, 투자, 트레이딩 또는 기타 유형의 조언이나 권장 사항으로 간주되지 않으며, 트레이딩뷰에서 제공하거나 보증하는 것이 아닙니다. 자세한 내용은 이용 약관을 참조하세요.
면책사항
해당 정보와 게시물은 금융, 투자, 트레이딩 또는 기타 유형의 조언이나 권장 사항으로 간주되지 않으며, 트레이딩뷰에서 제공하거나 보증하는 것이 아닙니다. 자세한 내용은 이용 약관을 참조하세요.