
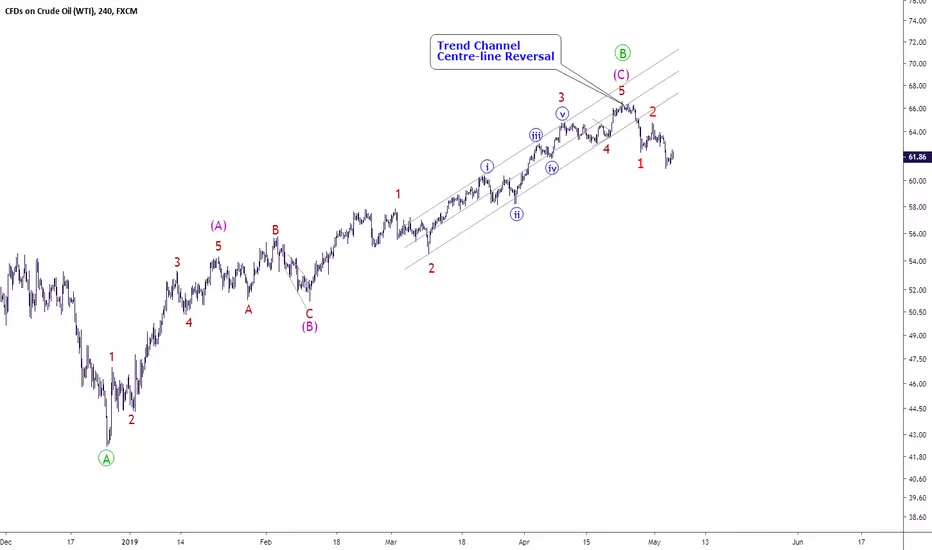
It might be bit early to call the end of bullish rally since late December 2018. But we could certainly have a count that shows wave (C) of {B} has reached it's peak.
노트
But the above count does not necessarily mean the start of the multi months bear market, here is an alternative count노트
possible Long-term wave count노트
Divergence between RSI & Price, but price is still trading above the blue up trend line
노트
short-term count노트
any push above 64.72 would argue either wave 4 or wave 5 is under way노트
노트
break below the blue wave {i} low at 60.04 would indicate wave {iii} decline is under way노트
there are two possible bearish counts: either 1-2 or 1-2 plus {i}-{ii}노트
노트
The '1-2' scenario also has two possible counts flat {b} of 2
triangle {b} of 2
노트
break below 62.09 ( end of wave (i) of {c} of 2) would indicate blue wave {c} is done노트
The '1-2 plus {i}-{ii}' scenario 노트
노트
also notice that price has failed number of times to climb back above the uptrend line노트
Therefore I think it's less likely to see another wave 5 of (C). A solid close below $60.02 (6 May low) would confirm the above bearish counts.노트
is wave 3 ready to explode?
노트
Short-term count노트
daily chart노트
we could also assume the 1-2 is one degree higher and count the structure as follows노트
노트
possible short-term counts:either
or
노트
노트
alternative count노트
노트
wave {iv} under way?
노트
노트
wave (iv) could be a triangle노트
노트
possible short-term counts:wave 3 done ( or if 1-2 = (1)-(2), then 3 = 1 of (3) )
노트
or wave (i)-(ii) of {v} 노트
immediate break above end of wave {iv} at $53.36 would eliminate the above (i)-(ii) scenario노트
노트
wave 4 or wave 2 of (3)노트
노트
triangle or flat?
노트
triangleor flat
노트
노트
{a}-{b}-{c} flat with a diagonal wave {c}?노트
노트
or an impulse wave {c}노트
노트
possible short-term count노트
possible short-term count노트
either way 노트
노트
let's see if guppy ema could trigger the bearish signal노트
a solid close below wave (iv) low at $57.73 would also argue wave 2 has reached it's peak노트
노트
break below wave {a}(of 2) high at $54.80 would confirm the above bearish count노트
possible short-term count노트
key resistance at $58.32 as wave iv should not breach the end of wave i노트
possible short-term countsor
노트
note the rally from recent low at 56.03 is contained within a parallel channel노트
triple zigzag?
노트
노트
Need to see an impulsive decline to break below the end of wave x at 57.30노트
노트
alternative count노트
possible short-term count노트
possible short-term count노트
노트
either pink A-B-C complete (Y) or grey (1)-(2) then {i}-{ii}노트
노트
Note on 11 July, i assumed the following two scenarios:Bullish A-B-C for wave (Y)
Bearish (1)-(2)
노트
the bullish count is no longer valid, simply because wave B of a zigzag can never move beyond the start of wave A노트
노트
possible short term counts노트
bearish green {i}-{ii}-(i)-(ii)OR
bullish grey A-B-C flat for wave (2)
노트
노트
노트
노트
no change노트
Complex flat for wave (2)Simple flat for wave (2)
노트
OR even a more complex correction for wave (2) , e.g. double three combination where wave Y is a triangle노트
Flat or Combination
노트
there are some bullish possibilitiesor
노트
medium term expectationsOR

'When you have eliminated the impossible, whatever remains, however improbable must be the truth.'
Email:info@ewc.space
Email:info@ewc.space
관련 발행물
면책사항
해당 정보와 게시물은 금융, 투자, 트레이딩 또는 기타 유형의 조언이나 권장 사항으로 간주되지 않으며, 트레이딩뷰에서 제공하거나 보증하는 것이 아닙니다. 자세한 내용은 이용 약관을 참조하세요.
'When you have eliminated the impossible, whatever remains, however improbable must be the truth.'
Email:info@ewc.space
Email:info@ewc.space
관련 발행물
면책사항
해당 정보와 게시물은 금융, 투자, 트레이딩 또는 기타 유형의 조언이나 권장 사항으로 간주되지 않으며, 트레이딩뷰에서 제공하거나 보증하는 것이 아닙니다. 자세한 내용은 이용 약관을 참조하세요.