
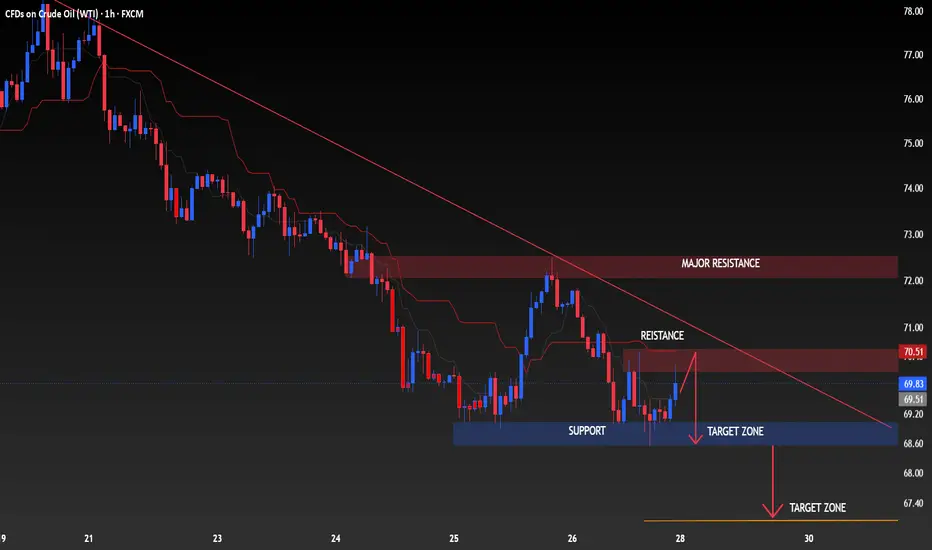
USOIL (WTI) – 1H Time Frame Analysis 📉 (Educational)
Current chart shows overall bearish structure with price trading below the descending trendline and reacting under resistance.
🔴 Sell Scenario (if rejection confirms):
📍 Entry Zone: 69.70 – 70.20
🎯 TP1: 68.60 (support / first target zone)
🎯 TP2: 67.40 (next target zone)
🎯 TP3: 66.50 (extended bearish move)
🛑 SL: Above 70.80 – 71.10
📌 Reasons:
• Price remains below major trendline
• Resistance zone still holding
• Lower highs structure active
• Bearish momentum still visible
⚠️ Wait for 1H candle confirmation before entry and manage risk (1–2%).
Caption:
“USOIL rejecting resistance — bearish continuation remains valid below trendline 📊🔥”
Current chart shows overall bearish structure with price trading below the descending trendline and reacting under resistance.
🔴 Sell Scenario (if rejection confirms):
📍 Entry Zone: 69.70 – 70.20
🎯 TP1: 68.60 (support / first target zone)
🎯 TP2: 67.40 (next target zone)
🎯 TP3: 66.50 (extended bearish move)
🛑 SL: Above 70.80 – 71.10
📌 Reasons:
• Price remains below major trendline
• Resistance zone still holding
• Lower highs structure active
• Bearish momentum still visible
⚠️ Wait for 1H candle confirmation before entry and manage risk (1–2%).
Caption:
“USOIL rejecting resistance — bearish continuation remains valid below trendline 📊🔥”
액티브 트레이드
active 
📲 Join telegram channel free .
t.me/addlist/7jtN1zcz9W05MDVk
Forex, Gold & Crypto Signals with detailed analysis & get consistent results.
Gold Signal's with proper TP & SL for high profit opportunities.
t.me/addlist/7jtN1zcz9W05MDVk
Forex, Gold & Crypto Signals with detailed analysis & get consistent results.
Gold Signal's with proper TP & SL for high profit opportunities.
관련 발행물
면책사항
해당 정보와 게시물은 금융, 투자, 트레이딩 또는 기타 유형의 조언이나 권장 사항으로 간주되지 않으며, 트레이딩뷰에서 제공하거나 보증하는 것이 아닙니다. 자세한 내용은 이용 약관을 참조하세요.
📲 Join telegram channel free .
t.me/addlist/7jtN1zcz9W05MDVk
Forex, Gold & Crypto Signals with detailed analysis & get consistent results.
Gold Signal's with proper TP & SL for high profit opportunities.
t.me/addlist/7jtN1zcz9W05MDVk
Forex, Gold & Crypto Signals with detailed analysis & get consistent results.
Gold Signal's with proper TP & SL for high profit opportunities.
관련 발행물
면책사항
해당 정보와 게시물은 금융, 투자, 트레이딩 또는 기타 유형의 조언이나 권장 사항으로 간주되지 않으며, 트레이딩뷰에서 제공하거나 보증하는 것이 아닙니다. 자세한 내용은 이용 약관을 참조하세요.