
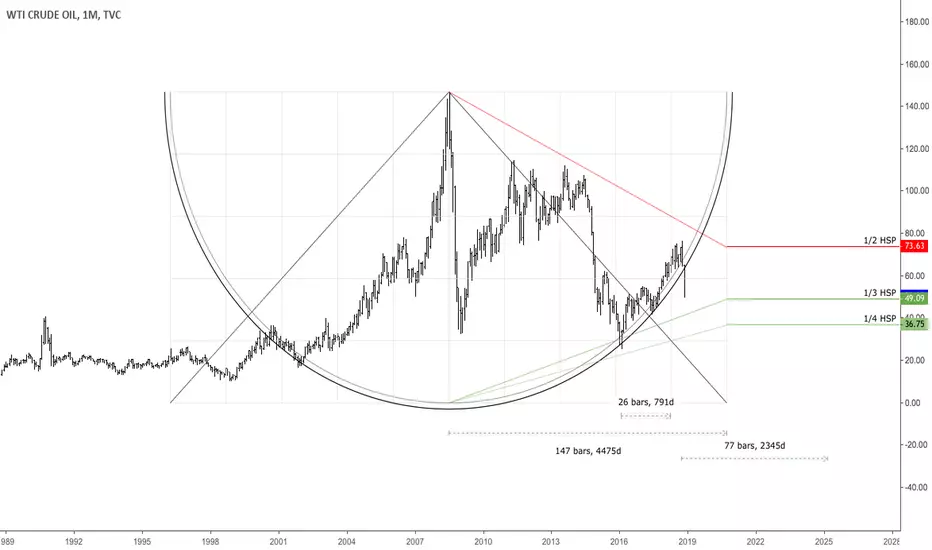
This is a monthly chart of USOIL with time cycles from important tops and bottoms. As shown in the chart, the current decline in oil started after 26 monthly bars since the bottom of $26 and around the 1/2 price area from highest selling price. Possible major pivot around the $48 area, which is the 1/3 of highest selling price of oil. If that goes, the next important area is the 1/4 of highest selling price around $36. It seems reasonable to look for long-term pivot around these price areas.

면책사항
해당 정보와 게시물은 금융, 투자, 트레이딩 또는 기타 유형의 조언이나 권장 사항으로 간주되지 않으며, 트레이딩뷰에서 제공하거나 보증하는 것이 아닙니다. 자세한 내용은 이용 약관을 참조하세요.
면책사항
해당 정보와 게시물은 금융, 투자, 트레이딩 또는 기타 유형의 조언이나 권장 사항으로 간주되지 않으며, 트레이딩뷰에서 제공하거나 보증하는 것이 아닙니다. 자세한 내용은 이용 약관을 참조하세요.