
Hi, this is my first post.
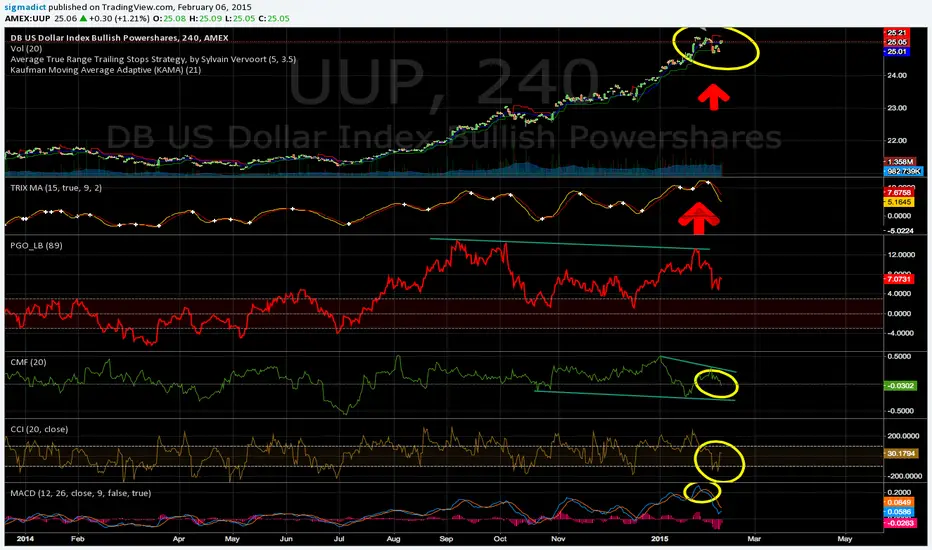
Sharing my view of US Dollar Index DXY threw UUP, where options can be trade.
I would suggest to be careful entering long at this point because of the followings:
1-Weekly chart Hanging Man (signal potential reverse of bullish trend)
2-ATR signalling we might be reversing trend in 4H chart (top yellow circle)
3-MACD lines crossed on 4H chart , also on Daily and 2Days
4-CMF divergence in 4H and is under zero (negative flow), Weekly chart CMF = 0.48, with maximum value of 0.50, Weekly MFI = 83.6 (overbought signal)
5-RSI Weekly chart at 81.2 (overbought signal)
6-Monthly chart touched RSI_BAND top band (overbought signal)
7-CCI touched (-100) + (potential reverse signal of momentum)
8-Stochastics Monthly chart is in overbought territory
9-We are at resistance
10-The look of this chart (personal)
Feel free to comment on my analysis.
Enjoy !
Sharing my view of US Dollar Index DXY threw UUP, where options can be trade.
I would suggest to be careful entering long at this point because of the followings:
1-Weekly chart Hanging Man (signal potential reverse of bullish trend)
2-ATR signalling we might be reversing trend in 4H chart (top yellow circle)
3-MACD lines crossed on 4H chart , also on Daily and 2Days
4-CMF divergence in 4H and is under zero (negative flow), Weekly chart CMF = 0.48, with maximum value of 0.50, Weekly MFI = 83.6 (overbought signal)
5-RSI Weekly chart at 81.2 (overbought signal)
6-Monthly chart touched RSI_BAND top band (overbought signal)
7-CCI touched (-100) + (potential reverse signal of momentum)
8-Stochastics Monthly chart is in overbought territory
9-We are at resistance
10-The look of this chart (personal)
Feel free to comment on my analysis.
Enjoy !

관련 발행물
면책사항
해당 정보와 게시물은 금융, 투자, 트레이딩 또는 기타 유형의 조언이나 권장 사항으로 간주되지 않으며, 트레이딩뷰에서 제공하거나 보증하는 것이 아닙니다. 자세한 내용은 이용 약관을 참조하세요.
면책사항
해당 정보와 게시물은 금융, 투자, 트레이딩 또는 기타 유형의 조언이나 권장 사항으로 간주되지 않으며, 트레이딩뷰에서 제공하거나 보증하는 것이 아닙니다. 자세한 내용은 이용 약관을 참조하세요.