
Because of contango, patterns on UVXY are hard to read because it is a bit like a fun house mirror - you get a completely warped and distorted view of supply / demand based price movement.
But when contango slows down, the distortion clears a bit.
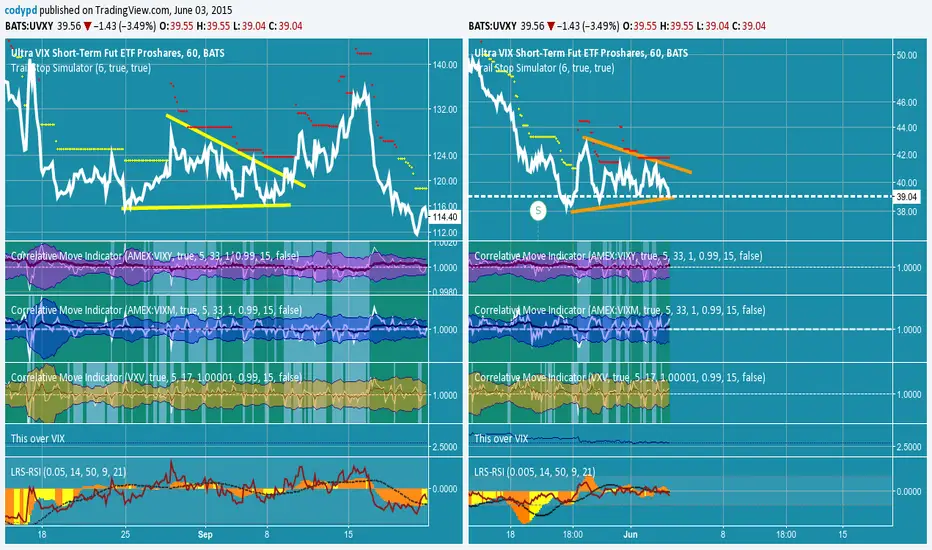
Last August the market was coming off of a depressed VIX (it was in the 10s) and volatility crept back in. On your left notice the wedge in yellow. Also notice the correlation indicators underneath that show backwardation of VIX futures (VIXY, VIXM, VXV) in the gray background (a background that is normally continuous green on that indicator when contango is in play). Now notice that it resolves itself with a higher VIX producing a higher UVXY without contango depressing the price movement.
On your right is the orange wedge that UVXY is now in along with the "stripes" in the correlation indicator showing backwardation events we have been seeing. Seems we are near a reawakening of volatility.
Click on this link to see that it is right on schedule.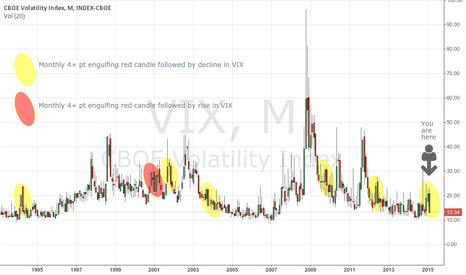
But when contango slows down, the distortion clears a bit.
Last August the market was coming off of a depressed VIX (it was in the 10s) and volatility crept back in. On your left notice the wedge in yellow. Also notice the correlation indicators underneath that show backwardation of VIX futures (VIXY, VIXM, VXV) in the gray background (a background that is normally continuous green on that indicator when contango is in play). Now notice that it resolves itself with a higher VIX producing a higher UVXY without contango depressing the price movement.
On your right is the orange wedge that UVXY is now in along with the "stripes" in the correlation indicator showing backwardation events we have been seeing. Seems we are near a reawakening of volatility.
Click on this link to see that it is right on schedule.

면책사항
해당 정보와 게시물은 금융, 투자, 트레이딩 또는 기타 유형의 조언이나 권장 사항으로 간주되지 않으며, 트레이딩뷰에서 제공하거나 보증하는 것이 아닙니다. 자세한 내용은 이용 약관을 참조하세요.
면책사항
해당 정보와 게시물은 금융, 투자, 트레이딩 또는 기타 유형의 조언이나 권장 사항으로 간주되지 않으며, 트레이딩뷰에서 제공하거나 보증하는 것이 아닙니다. 자세한 내용은 이용 약관을 참조하세요.