
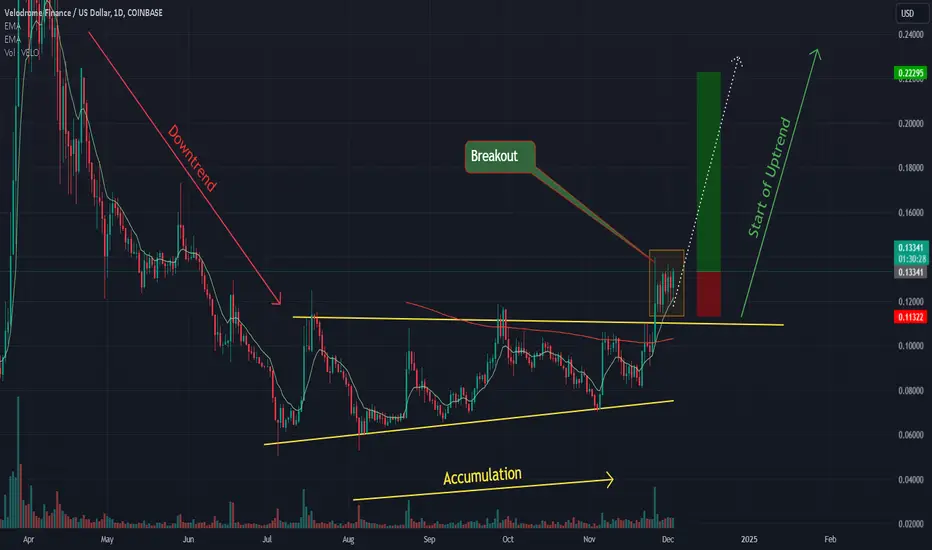
VELOUSD Daily Chart Analysis
VELOUSD has exhibited distinct market cycle phases, presenting a strong bullish setup
.
Key Observations
1. Market Cycle Phases:
o From April to July 2024, price underwent a steep downtrend, indicative of a distribution or markdown phase.
o Between July and November, price transitioned into an accumulation phase, consolidating within a defined range.
2. Breakout Confirmation:
o At the end of November/start of December, price broke out of the accumulation range.
o A spike in volume supports the validity of the breakout, and the price has sustained its position above the resistance level for 7 consecutive days, signaling strong buying pressure.
Trade Details
• Position: Long
• Entry: 0.13341
• Stop Loss: 0.11322 (15.13% risk)
• Target: 0.22295 (67.12% potential return)
• Risk-to-Reward Ratio: 4.43
Summary
The breakout from the accumulation range, supported by volume and momentum, suggests a continuation of bullish activity. The setup offers a favorable risk-to-reward ratio for long trades. Careful monitoring of the stop-loss level is recommended to protect against potential retracements.
거래청산: 타겟 닿음
BoomAlways nice to get a little more than expected lol. In this case more than double.
Exit: 0.32656, +144.78%, 9.57 RR ratio
노트
Re-entering trade longEntry: 0.27669
Stoploss: 0.26187, -5.36%
Target: Trailing 10ema 15min chart
노트
Trade close: Stop reached- dStoploss: 0.26187, -5.36%
면책사항
해당 정보와 게시물은 금융, 투자, 트레이딩 또는 기타 유형의 조언이나 권장 사항으로 간주되지 않으며, 트레이딩뷰에서 제공하거나 보증하는 것이 아닙니다. 자세한 내용은 이용 약관을 참조하세요.
면책사항
해당 정보와 게시물은 금융, 투자, 트레이딩 또는 기타 유형의 조언이나 권장 사항으로 간주되지 않으며, 트레이딩뷰에서 제공하거나 보증하는 것이 아닙니다. 자세한 내용은 이용 약관을 참조하세요.