업데이트됨
Ven Holders Dollar Chart
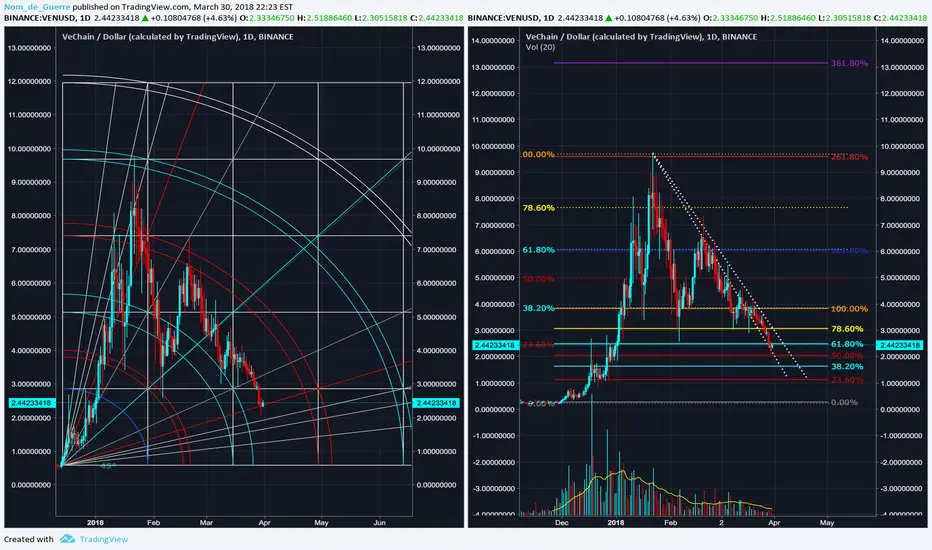
Sometimes the answers for price reversal are easier to see on dollar charts rather than btc pairs - The dollar price has caught on the red 2x3 Gann fib ray, if this breaks then we go to the 2x4 beneath, the action will happen at the arc pair, the top of the square the candles are in may stop the price - On the basic chart you can see the candles are caught in the downtrend channel but have found some support for now on a local range fib - Unless there is market moving news we may see another leg down, but i suspect that will be it, I'm holding on tight to the Xnode. If anything this is a great opportunity to increase holdings from 6K to 16K at discount price. I dont imagine i'm the only person who has thought of that so we may well see a sudden strong bounce. This is linked to the Ven/Btc holders chart
노트
Breakout 노트
Moving across the downtrends - Good volume 노트
Looking Healthy노트
노트
Skipped over another downtrend on the Dollar chart - Ven is looking good 노트
Ven beat all the major Usd downtrends and has found support currently against Btc - Closest major support marked in the dotted lines, resistance on the blue bands 노트
Bull pennant on both charts - Should get a kick upwards today 노트
Pennant Breakout 노트
Todays dip was no big deal for Ven - The candles need to retouch the uptrend i drew on the dollar chart 노트
Vern uptrend - Posted xrp by mistake :P 
관련 발행물
면책사항
해당 정보와 게시물은 금융, 투자, 트레이딩 또는 기타 유형의 조언이나 권장 사항으로 간주되지 않으며, 트레이딩뷰에서 제공하거나 보증하는 것이 아닙니다. 자세한 내용은 이용 약관을 참조하세요.
관련 발행물
면책사항
해당 정보와 게시물은 금융, 투자, 트레이딩 또는 기타 유형의 조언이나 권장 사항으로 간주되지 않으며, 트레이딩뷰에서 제공하거나 보증하는 것이 아닙니다. 자세한 내용은 이용 약관을 참조하세요.