업데이트됨
VeChain At The Key Support
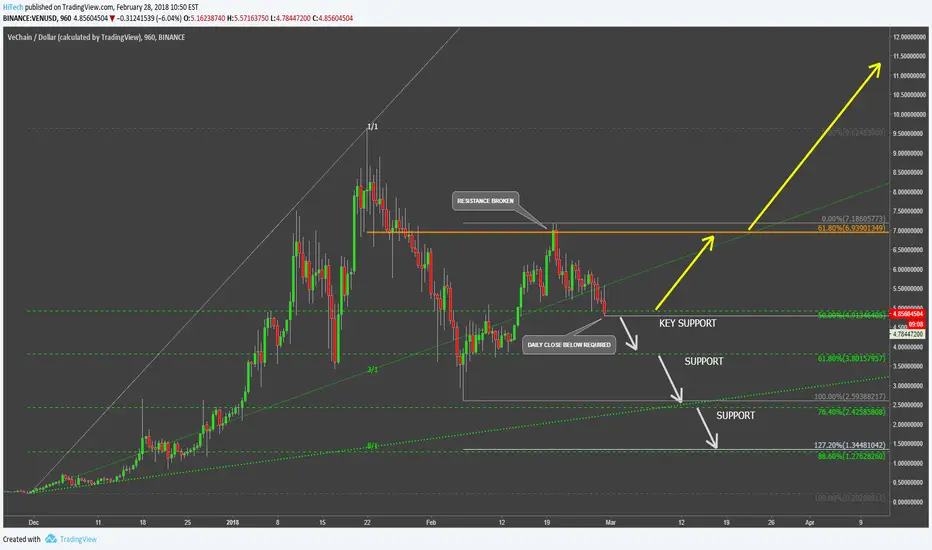
VeChain has reached the all-time high at $9.6, after which it corrected down to $2.6, losing 73% to the USD. Price failed to break with confidence below 61.8% Fibonacci retracement levels at $3.8 and below the 3/1 Gann Fan trendline, although it produced spikes lower.
After reaching the low at $2.6, VeChain recovered reaching the $7.1, and managed to break above the 61.8% Fibonacci retracement level, suggesting the validity of the uptrend. But now, VEN/USD is trading at the key support area, and the daily close below $4.7 would confirm the support and the Gann Fann trendline breakout. In this case, the price is likely to move down once again towards either $3.8, $2.4 or $1.27 support levels.
However if VeChain will avoid daily close below $4.7, the price could continue moving higher and potentially hit the $10 psychological resistance level. In any case, the major trend is up, but the risk of further correction down remains.
After reaching the low at $2.6, VeChain recovered reaching the $7.1, and managed to break above the 61.8% Fibonacci retracement level, suggesting the validity of the uptrend. But now, VEN/USD is trading at the key support area, and the daily close below $4.7 would confirm the support and the Gann Fann trendline breakout. In this case, the price is likely to move down once again towards either $3.8, $2.4 or $1.27 support levels.
However if VeChain will avoid daily close below $4.7, the price could continue moving higher and potentially hit the $10 psychological resistance level. In any case, the major trend is up, but the risk of further correction down remains.
노트
Daily close was below support, further decline becomes more likely거래청산: 타겟 닿음

면책사항
해당 정보와 게시물은 금융, 투자, 트레이딩 또는 기타 유형의 조언이나 권장 사항으로 간주되지 않으며, 트레이딩뷰에서 제공하거나 보증하는 것이 아닙니다. 자세한 내용은 이용 약관을 참조하세요.
면책사항
해당 정보와 게시물은 금융, 투자, 트레이딩 또는 기타 유형의 조언이나 권장 사항으로 간주되지 않으며, 트레이딩뷰에서 제공하거나 보증하는 것이 아닙니다. 자세한 내용은 이용 약관을 참조하세요.