Long
VIBE Token Reversal Potential
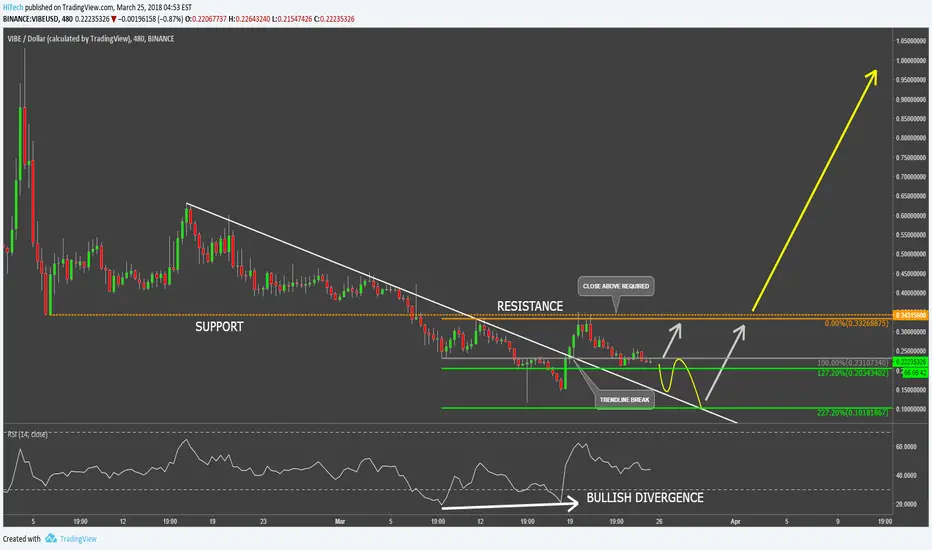
VIBE has experienced a continuous downtrend since inception, but the current price action shows signs of the potential reversal of the trend. VIBE/USD has reached an all-time low on the 15th of March while hitting $0.115. The RSI oscillator formed a bullish divergence and price managed to break above the downtrend trendline.
Although the previous support at $0.35 is now acting as a resistance that has been rejected twise. In order for VIBE to start an uptrend, a daily close above that resistance is required.
On a downside, if the resistance will continue to be respected, more consolidation could take place sending price to 227.2% Fibonacci support at $0.1 psychological round number.
Although the previous support at $0.35 is now acting as a resistance that has been rejected twise. In order for VIBE to start an uptrend, a daily close above that resistance is required.
On a downside, if the resistance will continue to be respected, more consolidation could take place sending price to 227.2% Fibonacci support at $0.1 psychological round number.
거래청산: 타겟 닿음

면책사항
해당 정보와 게시물은 금융, 투자, 트레이딩 또는 기타 유형의 조언이나 권장 사항으로 간주되지 않으며, 트레이딩뷰에서 제공하거나 보증하는 것이 아닙니다. 자세한 내용은 이용 약관을 참조하세요.
면책사항
해당 정보와 게시물은 금융, 투자, 트레이딩 또는 기타 유형의 조언이나 권장 사항으로 간주되지 않으며, 트레이딩뷰에서 제공하거나 보증하는 것이 아닙니다. 자세한 내용은 이용 약관을 참조하세요.