VITE/BTC
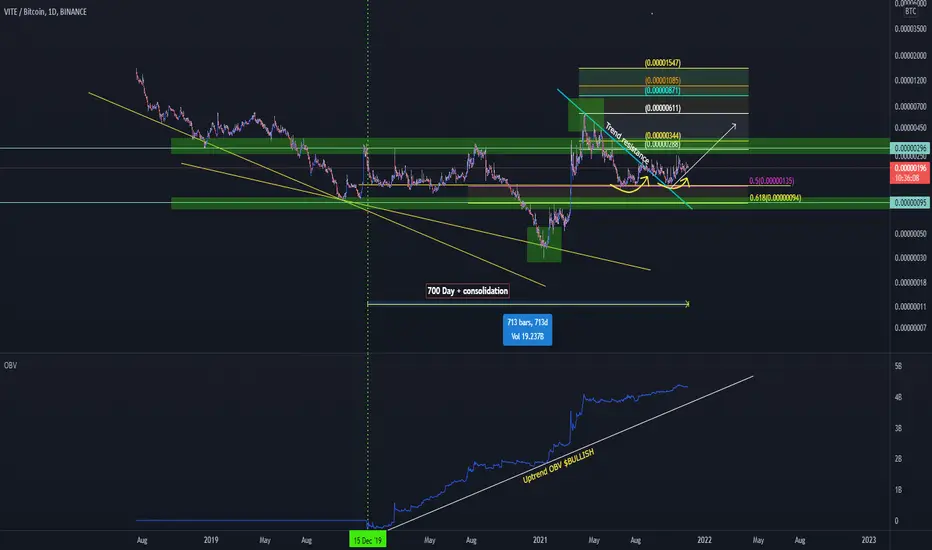
VITE/BTC like this setup.
VITE been in range/accumulation mode for almost 700days + with fake breakout and fake break down. Looking at OBV we have very clear divergence ( On-Balance Volume ) somebody is accumulating while the weak ones are exiting
Invalidation point 0.00000139 SAT.
On Balance Volume (OBV)=
On Balance Volume (OBV) measures buying and selling pressure as a cumulative indicator that adds volume on up days and subtracts volume on down days.
How this indicator works
The actual value of the OBV is unimportant; concentrate on its direction.
• When both price and OBV are making higher peaks and higher troughs, the upward trend is likely to continue.
• When both price and OBV are making lower peaks and lower troughs, the downward trend is likely to continue.
• During a trading range, if the OBV is rising, accumulation may be taking place—a warning of an upward breakout.
• During a trading range, if the OBV is falling, distribution may be taking place—a warning of a downward breakout.
• When price continues to make higher peaks and OBV fails to make higher peaks, the upward trend is likely to stall or fail. This is called a negative divergence.
• When price continues to make lower troughs and OBV fails to make lower troughs, the downward trend is likely to stall or fail. This is called a positive divergence.
Calculation
On Balance Volume is calculated by adding the day's volume to a cumulative total when the security's price closes up, and subtracting the day's volume when the security's price closes down.
If today's close is greater than yesterday's close then:
OBV = Yesterday’s OBV + Today’s Volume
If today’s close is less than yesterday’s close then:
OBV = Yesterday’s OBV – Today’s Volume
If today’s close is equal to yesterday’s close then:
OBV = Yesterday’s OBV
Vite/usdt
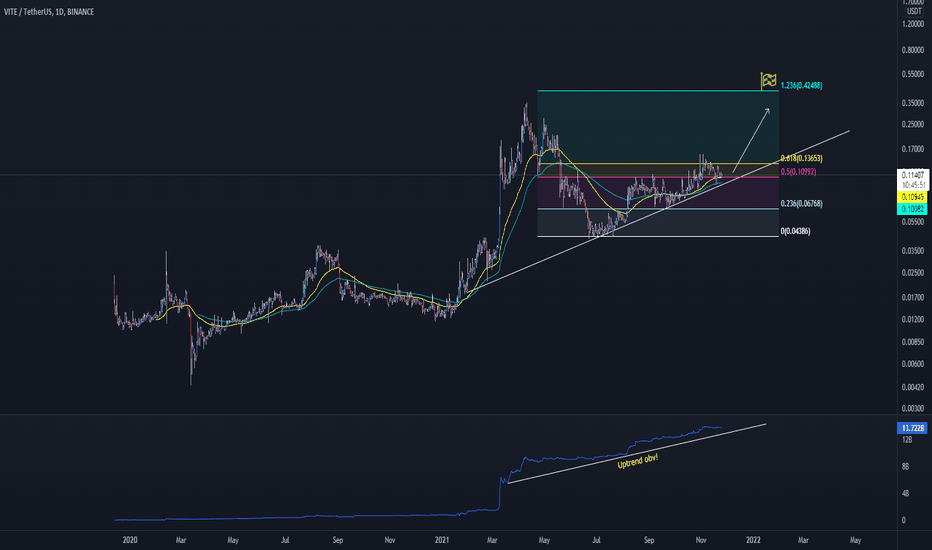
VITE been in range/accumulation mode for almost 700days + with fake breakout and fake break down. Looking at OBV we have very clear divergence ( On-Balance Volume ) somebody is accumulating while the weak ones are exiting
Invalidation point 0.00000139 SAT.
On Balance Volume (OBV)=
On Balance Volume (OBV) measures buying and selling pressure as a cumulative indicator that adds volume on up days and subtracts volume on down days.
How this indicator works
The actual value of the OBV is unimportant; concentrate on its direction.
• When both price and OBV are making higher peaks and higher troughs, the upward trend is likely to continue.
• When both price and OBV are making lower peaks and lower troughs, the downward trend is likely to continue.
• During a trading range, if the OBV is rising, accumulation may be taking place—a warning of an upward breakout.
• During a trading range, if the OBV is falling, distribution may be taking place—a warning of a downward breakout.
• When price continues to make higher peaks and OBV fails to make higher peaks, the upward trend is likely to stall or fail. This is called a negative divergence.
• When price continues to make lower troughs and OBV fails to make lower troughs, the downward trend is likely to stall or fail. This is called a positive divergence.
Calculation
On Balance Volume is calculated by adding the day's volume to a cumulative total when the security's price closes up, and subtracting the day's volume when the security's price closes down.
If today's close is greater than yesterday's close then:
OBV = Yesterday’s OBV + Today’s Volume
If today’s close is less than yesterday’s close then:
OBV = Yesterday’s OBV – Today’s Volume
If today’s close is equal to yesterday’s close then:
OBV = Yesterday’s OBV
Vite/usdt

면책사항
해당 정보와 게시물은 금융, 투자, 트레이딩 또는 기타 유형의 조언이나 권장 사항으로 간주되지 않으며, 트레이딩뷰에서 제공하거나 보증하는 것이 아닙니다. 자세한 내용은 이용 약관을 참조하세요.
면책사항
해당 정보와 게시물은 금융, 투자, 트레이딩 또는 기타 유형의 조언이나 권장 사항으로 간주되지 않으며, 트레이딩뷰에서 제공하거나 보증하는 것이 아닙니다. 자세한 내용은 이용 약관을 참조하세요.