
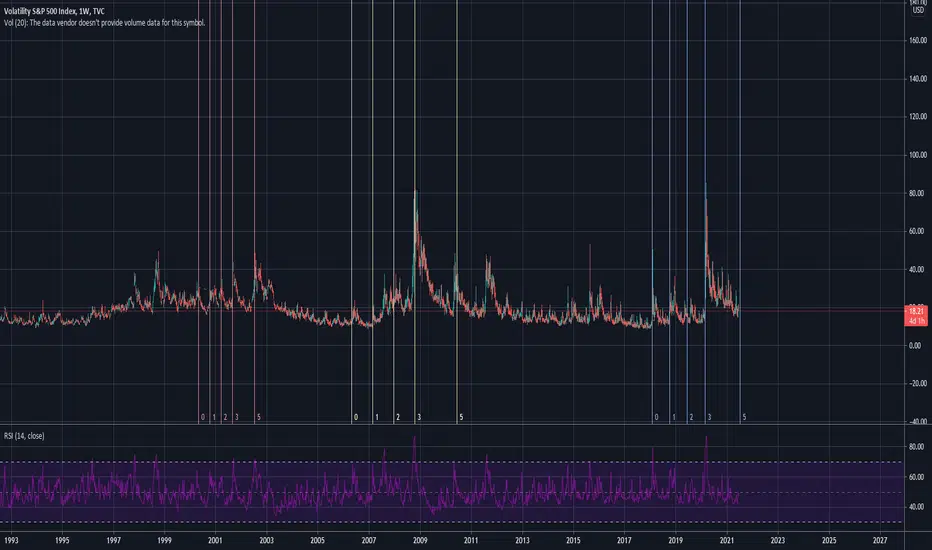
Vix has been consolidating for a while, making my options relatively cheap to buy.
I generally discount the fib time zone tool because it is entirely dependent on how it's drawn. It is easy to fall prey into drawing to fit the pattern after the fact and therefore very prone to being a subjective tool.
But this is at least interesting to draw to get a sense of rough price timing, especially with VIX since its precise magnitude doesn't matter.
Drawing the 0->1 between the first two peaks of the first two parabolic highs after a long consolidation gives the following pattern:
0: Peak
1: Peak
2: not interesting enough
3: Peak
5: Peak
any time zone beyond this figure is too crazy to even attempt (if timing the market is that easy we'd all be rich).
///
Never use this tool to make a decision.
That being said, it's interesting to look at and gives a broad perspective that volatility may be close to finishing its consolidation pattern in the coming months. Eyes peeled now.
I generally discount the fib time zone tool because it is entirely dependent on how it's drawn. It is easy to fall prey into drawing to fit the pattern after the fact and therefore very prone to being a subjective tool.
But this is at least interesting to draw to get a sense of rough price timing, especially with VIX since its precise magnitude doesn't matter.
Drawing the 0->1 between the first two peaks of the first two parabolic highs after a long consolidation gives the following pattern:
0: Peak
1: Peak
2: not interesting enough
3: Peak
5: Peak
any time zone beyond this figure is too crazy to even attempt (if timing the market is that easy we'd all be rich).
///
Never use this tool to make a decision.
That being said, it's interesting to look at and gives a broad perspective that volatility may be close to finishing its consolidation pattern in the coming months. Eyes peeled now.

면책사항
해당 정보와 게시물은 금융, 투자, 트레이딩 또는 기타 유형의 조언이나 권장 사항으로 간주되지 않으며, 트레이딩뷰에서 제공하거나 보증하는 것이 아닙니다. 자세한 내용은 이용 약관을 참조하세요.
면책사항
해당 정보와 게시물은 금융, 투자, 트레이딩 또는 기타 유형의 조언이나 권장 사항으로 간주되지 않으며, 트레이딩뷰에서 제공하거나 보증하는 것이 아닙니다. 자세한 내용은 이용 약관을 참조하세요.