
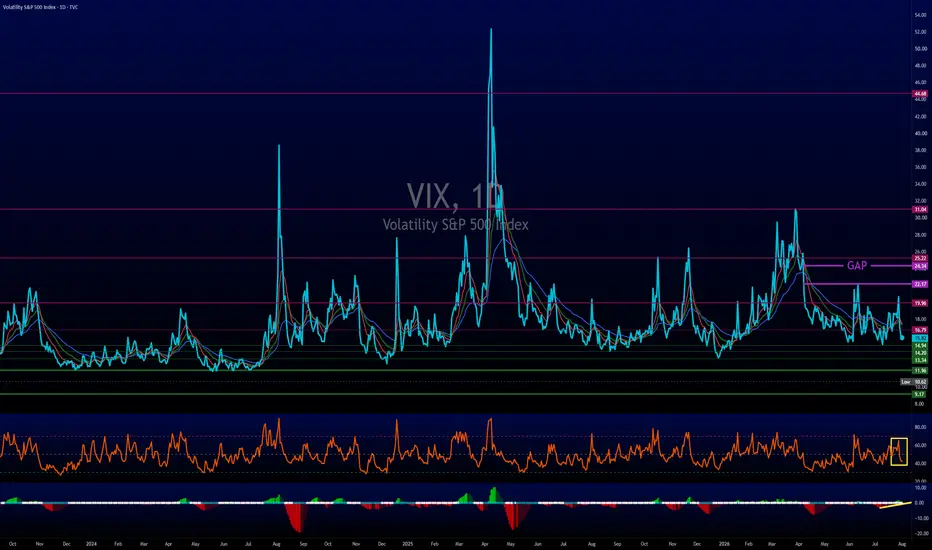
The daily chart shows the VIX sitting near the lower end of its usual range. This is the area where volatility often slows down and the market feels calm. Even though the VIX is low, it is not falling apart. The indicators on the chart still show signs of strength. The RSI is holding steady instead of dropping. That means traders are not fully letting go of protection. The true absolute bottom line in the sand sits closer to 13, but buyers keep stepping in before it ever gets there.
There are several clear support levels under the current price. These levels have held many times before. When the VIX reaches these zones it usually stops falling and starts moving sideways. Sometimes it even pops back up. The chart also shows open gaps, not see on line charts, above the current price. Gaps often act like magnets. When the VIX starts rising again it often moves toward these gaps.
What Comes Next?
When fear stays this compressed at the bottom of a range, downside room becomes limited. A quick push can open up a fast move toward 20, with a major overhead gap waiting near 24 to 25 if a real catalyst lands.
As long as headline threats get walked back, markets can continue a slow grind higher. Just keep in mind that sitting at the bottom of the range means volatility is cheap and coiled for the next spike.
There are several clear support levels under the current price. These levels have held many times before. When the VIX reaches these zones it usually stops falling and starts moving sideways. Sometimes it even pops back up. The chart also shows open gaps, not see on line charts, above the current price. Gaps often act like magnets. When the VIX starts rising again it often moves toward these gaps.
What Comes Next?
When fear stays this compressed at the bottom of a range, downside room becomes limited. A quick push can open up a fast move toward 20, with a major overhead gap waiting near 24 to 25 if a real catalyst lands.
As long as headline threats get walked back, markets can continue a slow grind higher. Just keep in mind that sitting at the bottom of the range means volatility is cheap and coiled for the next spike.

관련 발행물
면책사항
해당 정보와 게시물은 금융, 투자, 트레이딩 또는 기타 유형의 조언이나 권장 사항으로 간주되지 않으며, 트레이딩뷰에서 제공하거나 보증하는 것이 아닙니다. 자세한 내용은 이용 약관을 참조하세요.
면책사항
해당 정보와 게시물은 금융, 투자, 트레이딩 또는 기타 유형의 조언이나 권장 사항으로 간주되지 않으며, 트레이딩뷰에서 제공하거나 보증하는 것이 아닙니다. 자세한 내용은 이용 약관을 참조하세요.