
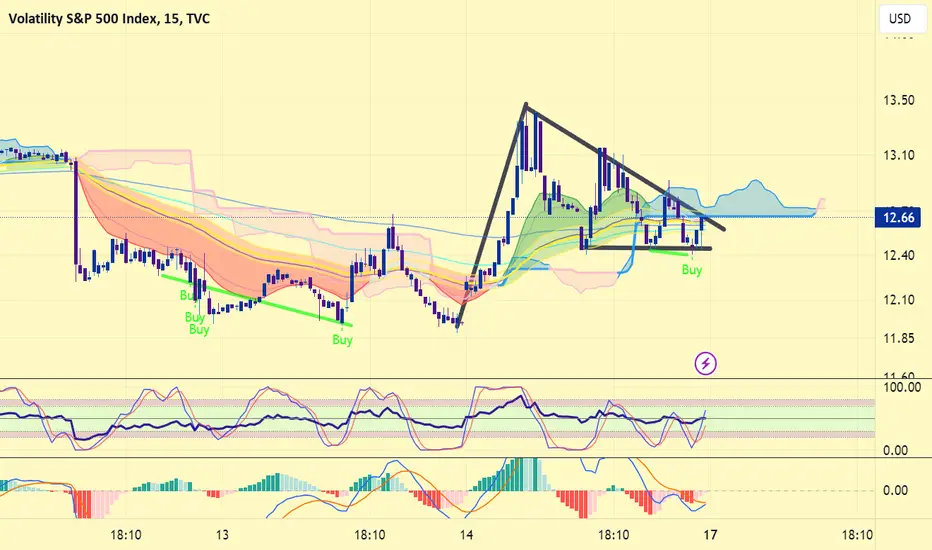
#vix volatility index chart made double bottom and W bounced. The bullish movement will likely continue even more while the chart made bullish flag in lower time frame.
Also recent days #dxy dollar index chart made a bullish breakout and while VIX and DXY are both getting stronger, this will not likely be good for #btc #altcoins #stocks etc. I think something is cooking... Better not to be over greedy. Not financial advice.
Also recent days #dxy dollar index chart made a bullish breakout and while VIX and
DXY are both getting stronger, this will not likely be good for #btc #altcoins #stocks etc. I think something is cooking... Better not to be over greedy. Not financial advice.
관련 발행물
면책사항
해당 정보와 게시물은 금융, 투자, 트레이딩 또는 기타 유형의 조언이나 권장 사항으로 간주되지 않으며, 트레이딩뷰에서 제공하거나 보증하는 것이 아닙니다. 자세한 내용은 이용 약관을 참조하세요.
면책사항
해당 정보와 게시물은 금융, 투자, 트레이딩 또는 기타 유형의 조언이나 권장 사항으로 간주되지 않으며, 트레이딩뷰에서 제공하거나 보증하는 것이 아닙니다. 자세한 내용은 이용 약관을 참조하세요.