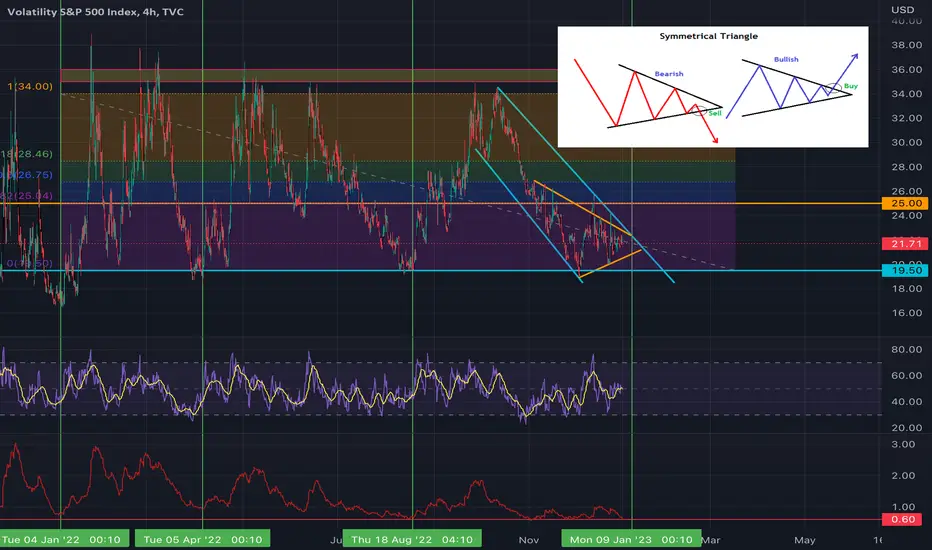
DESCRIPTION: The chart above is an analysis of the VIX and it current pattern formation of a SYMMETRICAL TRIANGLE FORMATION.
POINTS:
1. Strong Support for VIX at 19.50 with current Demand Pocket Ceiling for FIB is at 25.
2. Move should occur by the 9th of January as price action would have to compress a lot more by then.
3. Current overall trend is a down trend that we have been seeing for VIX since early October.
SCENARIO #1: If break of Symmetrical Triangle occurs towards the downside expect a bounce at 19.50.
SCENARIO #2: If break of Symmetrical Triangle occurs towards the upside expect resistance at 25.
*NOTE: NO RECESSION HAS EVER ENDED WITHOUT A VIX SPIKE TO 45 AT LEAST.
 VIX
VIX
POINTS:
1. Strong Support for VIX at 19.50 with current Demand Pocket Ceiling for FIB is at 25.
2. Move should occur by the 9th of January as price action would have to compress a lot more by then.
3. Current overall trend is a down trend that we have been seeing for VIX since early October.
SCENARIO #1: If break of Symmetrical Triangle occurs towards the downside expect a bounce at 19.50.
SCENARIO #2: If break of Symmetrical Triangle occurs towards the upside expect resistance at 25.
*NOTE: NO RECESSION HAS EVER ENDED WITHOUT A VIX SPIKE TO 45 AT LEAST.
VIX
관련 발행물
면책사항
해당 정보와 게시물은 금융, 투자, 트레이딩 또는 기타 유형의 조언이나 권장 사항으로 간주되지 않으며, 트레이딩뷰에서 제공하거나 보증하는 것이 아닙니다. 자세한 내용은 이용 약관을 참조하세요.
관련 발행물
면책사항
해당 정보와 게시물은 금융, 투자, 트레이딩 또는 기타 유형의 조언이나 권장 사항으로 간주되지 않으며, 트레이딩뷰에서 제공하거나 보증하는 것이 아닙니다. 자세한 내용은 이용 약관을 참조하세요.