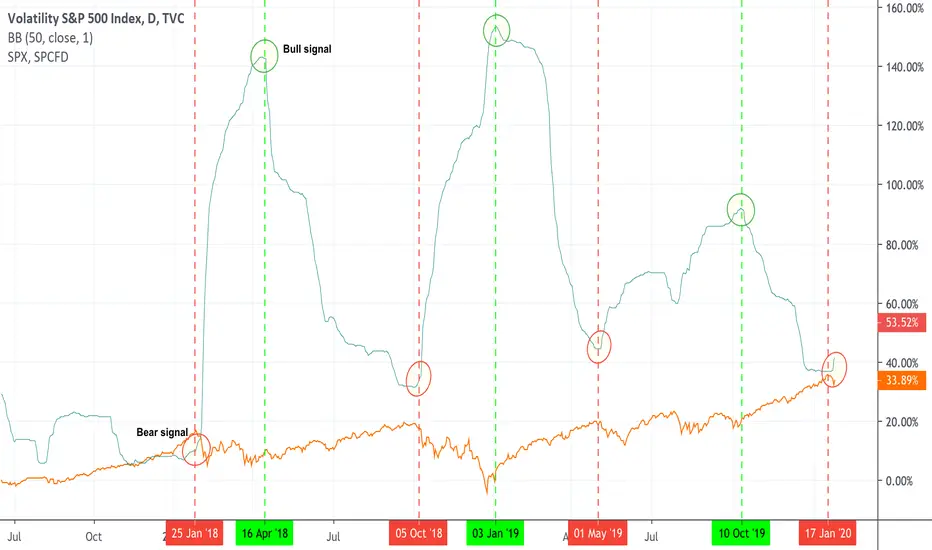
I follow a CFA from Charles Schwab, who uses this signal to establish negative or positive sentiment. To notice how it worked in the past, I have added the S&P500 trend line.
The idea is as follows:
When the upper Bollinger Band (with a 50 period and 1 standard deviation) on the VIX turns higher, that is a bearish sign, and when it turns lower, the SPY tends to rally.
-----------
Also, today January 28th, we had a Hindenburg Omen flash.
The idea is as follows:
When the upper Bollinger Band (with a 50 period and 1 standard deviation) on the
VIX turns higher, that is a bearish sign, and when it turns lower, the SPY tends to rally.-----------
Also, today January 28th, we had a Hindenburg Omen flash.

면책사항
해당 정보와 게시물은 금융, 투자, 트레이딩 또는 기타 유형의 조언이나 권장 사항으로 간주되지 않으며, 트레이딩뷰에서 제공하거나 보증하는 것이 아닙니다. 자세한 내용은 이용 약관을 참조하세요.
면책사항
해당 정보와 게시물은 금융, 투자, 트레이딩 또는 기타 유형의 조언이나 권장 사항으로 간주되지 않으며, 트레이딩뷰에서 제공하거나 보증하는 것이 아닙니다. 자세한 내용은 이용 약관을 참조하세요.