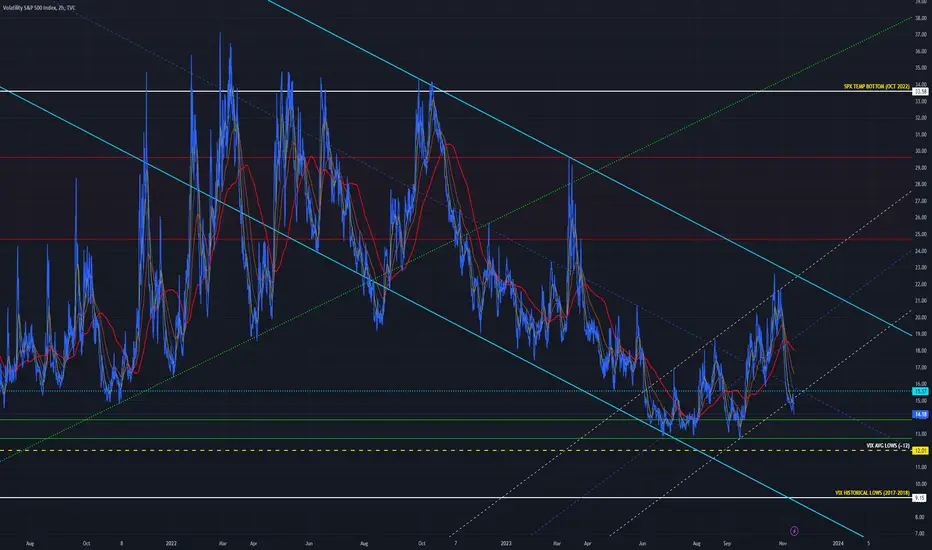
 VIX chart mapping/analysis.
Always been a firm-believer in strong negative correlation with SPX.
Key is not matching SPX highs with VIX lows ie "catching the bottom" - it should be used as a supplementary indicator for overall market direction, by identifying key support/resistance areas for trend switches that aids you in developing a Trading Edge.
Chart Example:
- October 2022 peak in VIX marked (temporary?) bottom in SPX
- VIX unable to break above ~34 resistance zone after multiple attempts = gives way to lower highs & lower lows (change in trend)
- SPX responds by making series of higher highs & higher lows
- VIX bottoms around July 2023, unable to break below ~13 resistance zone (ie trend switch)
- SPX peaks in July & proceeds to pull back until recent reversal - coinciding with dramatic drop in volatility
This is by no means a done & dusted chart - after all it's called the "Volatility Index" lol.
It will require ongoing tweaking, back-testing & confluence with SPX TA work, as well as vigilance of evolving macro-economic events which get rapidly priced into both indices.
Good luck :)
Note: "SPX TEMP BOTTOM horizontal line should be adjusted higher to sit on VIX peaks - can't edit chart & cbf re-publishing...but you get the idea, cheers.

관련 발행물
면책사항
해당 정보와 게시물은 금융, 투자, 트레이딩 또는 기타 유형의 조언이나 권장 사항으로 간주되지 않으며, 트레이딩뷰에서 제공하거나 보증하는 것이 아닙니다. 자세한 내용은 이용 약관을 참조하세요.
면책사항
해당 정보와 게시물은 금융, 투자, 트레이딩 또는 기타 유형의 조언이나 권장 사항으로 간주되지 않으며, 트레이딩뷰에서 제공하거나 보증하는 것이 아닙니다. 자세한 내용은 이용 약관을 참조하세요.