
Hello traders,
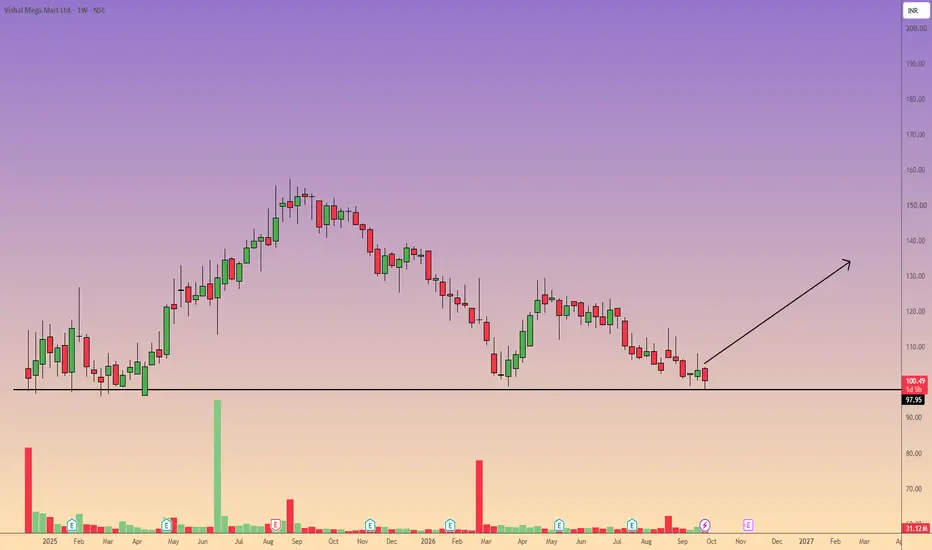
Looking at the weekly chart for Vishal Mega Mart Ltd. (NSE), we can observe a prolonged corrective phase after the stock peaked near the ₹150–155 range late last year.
The price has been printing lower highs and lower lows for several months, reflecting strong bearish momentum.
However, the stock is currently hovering at ₹100.60 and is testing a major historical support level at ₹97.95 (indicated by the solid black horizontal line).
This is a critical "make-or-break" zone. Historically, this level acted as a strong base in early 2025 before initiating a massive multi-month rally.
Technical Rationale:
Because this is a weekly timeframe, the ₹98 level represents significant structural support.
The current price action shows consolidation just above this line. If buyers step in to defend this zone, we could see a strong bounce or trend reversal.
Conversely, a high-volume breakdown below this baseline could trigger a deeper sell-off. Therefore, patience is key—waiting for a clear bullish reversal pattern (like a hammer or bullish engulfing candle) on the daily or weekly timeframe is recommended before entering.
Potential Trade Setup (Long Bias upon Confirmation):
Entry Point: ₹98.00 – ₹101.00 (Enter only after seeing bullish price action confirmation at this support zone).
Target 1 (TP1): ₹120.00 (Previous minor swing high and resistance zone).
Target 2 (TP2): ₹135.00 (Major structural resistance from previous breakdown levels).
Stop Loss: A weekly close below ₹94.00. (Closing definitively below the ₹97.95 support line invalidates the bullish thesis and suggests further downside).
Looking at the weekly chart for Vishal Mega Mart Ltd. (NSE), we can observe a prolonged corrective phase after the stock peaked near the ₹150–155 range late last year.
The price has been printing lower highs and lower lows for several months, reflecting strong bearish momentum.
However, the stock is currently hovering at ₹100.60 and is testing a major historical support level at ₹97.95 (indicated by the solid black horizontal line).
This is a critical "make-or-break" zone. Historically, this level acted as a strong base in early 2025 before initiating a massive multi-month rally.
Technical Rationale:
Because this is a weekly timeframe, the ₹98 level represents significant structural support.
The current price action shows consolidation just above this line. If buyers step in to defend this zone, we could see a strong bounce or trend reversal.
Conversely, a high-volume breakdown below this baseline could trigger a deeper sell-off. Therefore, patience is key—waiting for a clear bullish reversal pattern (like a hammer or bullish engulfing candle) on the daily or weekly timeframe is recommended before entering.
Potential Trade Setup (Long Bias upon Confirmation):
Entry Point: ₹98.00 – ₹101.00 (Enter only after seeing bullish price action confirmation at this support zone).
Target 1 (TP1): ₹120.00 (Previous minor swing high and resistance zone).
Target 2 (TP2): ₹135.00 (Major structural resistance from previous breakdown levels).
Stop Loss: A weekly close below ₹94.00. (Closing definitively below the ₹97.95 support line invalidates the bullish thesis and suggests further downside).
거래청산: 스탑 닿음
Stoploss Hit...
면책사항
해당 정보와 게시물은 금융, 투자, 트레이딩 또는 기타 유형의 조언이나 권장 사항으로 간주되지 않으며, 트레이딩뷰에서 제공하거나 보증하는 것이 아닙니다. 자세한 내용은 이용 약관을 참조하세요.
면책사항
해당 정보와 게시물은 금융, 투자, 트레이딩 또는 기타 유형의 조언이나 권장 사항으로 간주되지 않으며, 트레이딩뷰에서 제공하거나 보증하는 것이 아닙니다. 자세한 내용은 이용 약관을 참조하세요.