
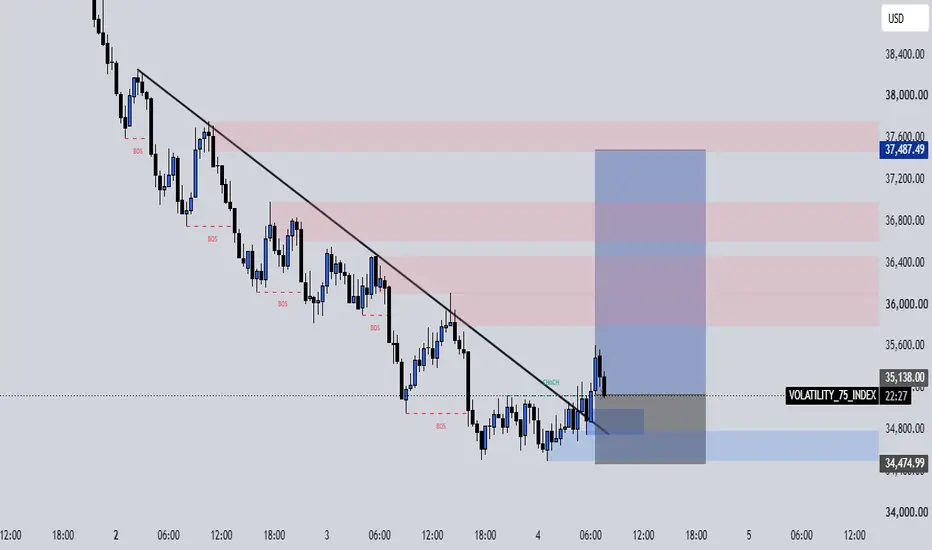
VOLATILITY 75 INDEX – BUY Analysis
1. Market Structure: The market was previously in a downtrend, forming Lower Highs and Lower Lows.
2. BOS (Break of Structure): Red BOS labels show where price broke previous support levels, confirming bearish momentum.
3. Trendline: The black descending trendline shows the previous bearish direction. Price later broke above it.
4. Supply Zones: Red areas represent potential selling zones where price may face resistance.
5. Demand Zone: The blue area represents a potential buying zone where buyers may enter.
6. CHoCH: The green CHoCH indicates a possible change from bearish to bullish market structure.
7. BUY Setup:
Entry: 35,138.00
Take Profit: 37,487.49
Stop Loss: 34,474.99
Conclusion: Price is showing signs of a bullish reversal after reacting to the demand zone and breaking the descending trendline. A BUY opportunity is possible, but always wait for confirmation and manage your risk.
1. Market Structure: The market was previously in a downtrend, forming Lower Highs and Lower Lows.
2. BOS (Break of Structure): Red BOS labels show where price broke previous support levels, confirming bearish momentum.
3. Trendline: The black descending trendline shows the previous bearish direction. Price later broke above it.
4. Supply Zones: Red areas represent potential selling zones where price may face resistance.
5. Demand Zone: The blue area represents a potential buying zone where buyers may enter.
6. CHoCH: The green CHoCH indicates a possible change from bearish to bullish market structure.
7. BUY Setup:
Entry: 35,138.00
Take Profit: 37,487.49
Stop Loss: 34,474.99
Conclusion: Price is showing signs of a bullish reversal after reacting to the demand zone and breaking the descending trendline. A BUY opportunity is possible, but always wait for confirmation and manage your risk.

면책사항
해당 정보와 게시물은 금융, 투자, 트레이딩 또는 기타 유형의 조언이나 권장 사항으로 간주되지 않으며, 트레이딩뷰에서 제공하거나 보증하는 것이 아닙니다. 자세한 내용은 이용 약관을 참조하세요.
면책사항
해당 정보와 게시물은 금융, 투자, 트레이딩 또는 기타 유형의 조언이나 권장 사항으로 간주되지 않으며, 트레이딩뷰에서 제공하거나 보증하는 것이 아닙니다. 자세한 내용은 이용 약관을 참조하세요.