
Long-term buying opportunity for valuable and growth stock VPB
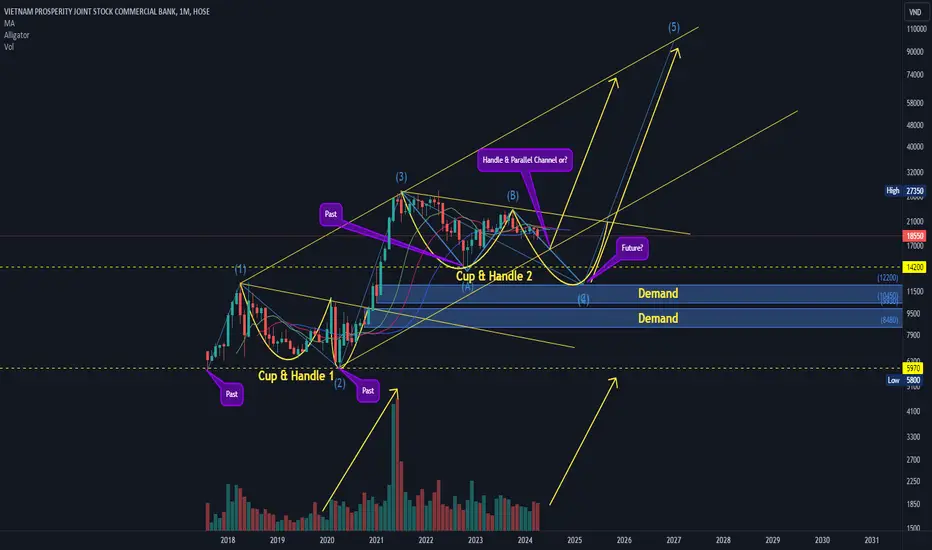
By examining the monthly chart of VPB stock, we can observe a pattern resembling a "cup and handle" formation, albeit with a significant downward movement prior to this pattern. This deviation from the textbook "cup and handle" could potentially classify it as a "double bottom" formation. However, considering the market's turmoil during the COVID-19 pandemic, the widespread sell-off, and VPB's relatively recent IPO, investor confidence might have been initially low. Nevertheless, a remarkable recovery ensued, culminating in a textbook Elliott wave 3 surge.
Currently, the stock appears to be in the "handle" phase of the cup and handle formation. Based on the two previous peaks, a parallel price channel can be drawn, suggesting that the bottom of the ABC corrective wave could lie around the "Handle & Parallel Channel" zone marked at 16.6k.
Alternatively, following the principles of supply and demand, the bottom of wave 4 or the conclusion of wave ABC could reside within the highlighted demand zone around 12.2k. This zone also coincides with a previous break below the "cup" level, which subsequently formed a second "double bottom" pattern and continued its upward trend with a bullish flag formation.
As market participants, we should closely monitor the price action around these support zones and await clear signals before entering the market.
Currently, the stock appears to be in the "handle" phase of the cup and handle formation. Based on the two previous peaks, a parallel price channel can be drawn, suggesting that the bottom of the ABC corrective wave could lie around the "Handle & Parallel Channel" zone marked at 16.6k.
Alternatively, following the principles of supply and demand, the bottom of wave 4 or the conclusion of wave ABC could reside within the highlighted demand zone around 12.2k. This zone also coincides with a previous break below the "cup" level, which subsequently formed a second "double bottom" pattern and continued its upward trend with a bullish flag formation.
As market participants, we should closely monitor the price action around these support zones and await clear signals before entering the market.

면책사항
해당 정보와 게시물은 금융, 투자, 트레이딩 또는 기타 유형의 조언이나 권장 사항으로 간주되지 않으며, 트레이딩뷰에서 제공하거나 보증하는 것이 아닙니다. 자세한 내용은 이용 약관을 참조하세요.
면책사항
해당 정보와 게시물은 금융, 투자, 트레이딩 또는 기타 유형의 조언이나 권장 사항으로 간주되지 않으며, 트레이딩뷰에서 제공하거나 보증하는 것이 아닙니다. 자세한 내용은 이용 약관을 참조하세요.