
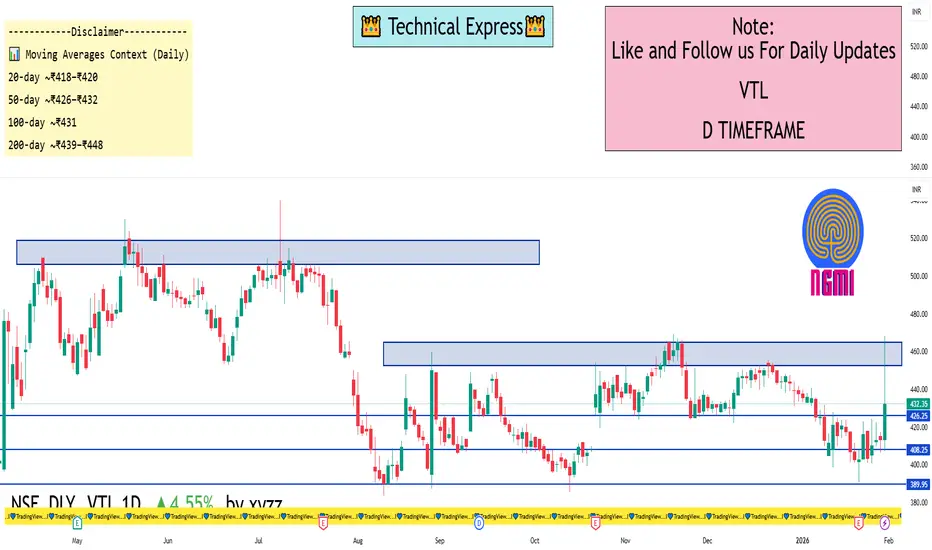
📍 Latest Price Context (Daily Close)
Approx. share price: ~₹432 – ₹433 on NSE (close of last session).
Today’s range (recent session): High ~₹468, Low ~₹407.45.
52-week range: Low ~₹361.10, High ~₹539.90.
📊 Key Daily Levels (1-Day Time Frame)
🔑 Pivot & Intraday Levels
(Based on pivot point calculations for the daily session)
Central Pivot (Daily): ~₹412.33 – baseline pivot for directional bias.
📈 Resistance Levels
R1 ~₹418 – ₹423 – first near-term resistance zone.
R2 ~₹423 – ₹429 – next resistance above pivot.
R3 ~₹429 – ₹446 (or higher intraday) – notable upper resistance zone if price strengthens.
👉 Bullish scenario: Daily close above ~₹429-₹435 could trigger further upside momentum toward higher resistance zones (based on recent highs).
📉 Support Levels
S1 ~₹407 – ₹410 – short-term support near today’s low zone.
S2 ~₹401 – ₹405 – secondary support if price declines below S1.
S3 ~₹396 – ₹399 – deeper support on a pullback.
👉 Bearish scenario: A daily close below ~₹401-₹396 may open further decline toward lower support clusters.
📌 Simple Interpretation (Daily TF)
📍 Above Pivot (~₹412): Slightly bullish / range control.
📍 Holding Support (~₹407 – ₹401): Helps limit downside.
📍 Break above ~₹429: Potential for continuation to next resistance area.
📍 Break below ~₹396: Bearish momentum intensifies.
⚠️ Notes
Levels are based on standard pivot and support/resistance derivations — actual intraday price action may vary with market volatility.
For live charts and real-time plotting, it’s best to check TradingView, your broker’s charting tool, or other live market platforms.
Approx. share price: ~₹432 – ₹433 on NSE (close of last session).
Today’s range (recent session): High ~₹468, Low ~₹407.45.
52-week range: Low ~₹361.10, High ~₹539.90.
📊 Key Daily Levels (1-Day Time Frame)
🔑 Pivot & Intraday Levels
(Based on pivot point calculations for the daily session)
Central Pivot (Daily): ~₹412.33 – baseline pivot for directional bias.
📈 Resistance Levels
R1 ~₹418 – ₹423 – first near-term resistance zone.
R2 ~₹423 – ₹429 – next resistance above pivot.
R3 ~₹429 – ₹446 (or higher intraday) – notable upper resistance zone if price strengthens.
👉 Bullish scenario: Daily close above ~₹429-₹435 could trigger further upside momentum toward higher resistance zones (based on recent highs).
📉 Support Levels
S1 ~₹407 – ₹410 – short-term support near today’s low zone.
S2 ~₹401 – ₹405 – secondary support if price declines below S1.
S3 ~₹396 – ₹399 – deeper support on a pullback.
👉 Bearish scenario: A daily close below ~₹401-₹396 may open further decline toward lower support clusters.
📌 Simple Interpretation (Daily TF)
📍 Above Pivot (~₹412): Slightly bullish / range control.
📍 Holding Support (~₹407 – ₹401): Helps limit downside.
📍 Break above ~₹429: Potential for continuation to next resistance area.
📍 Break below ~₹396: Bearish momentum intensifies.
⚠️ Notes
Levels are based on standard pivot and support/resistance derivations — actual intraday price action may vary with market volatility.
For live charts and real-time plotting, it’s best to check TradingView, your broker’s charting tool, or other live market platforms.

관련 발행물
면책사항
해당 정보와 게시물은 금융, 투자, 트레이딩 또는 기타 유형의 조언이나 권장 사항으로 간주되지 않으며, 트레이딩뷰에서 제공하거나 보증하는 것이 아닙니다. 자세한 내용은 이용 약관을 참조하세요.
관련 발행물
면책사항
해당 정보와 게시물은 금융, 투자, 트레이딩 또는 기타 유형의 조언이나 권장 사항으로 간주되지 않으며, 트레이딩뷰에서 제공하거나 보증하는 것이 아닙니다. 자세한 내용은 이용 약관을 참조하세요.