
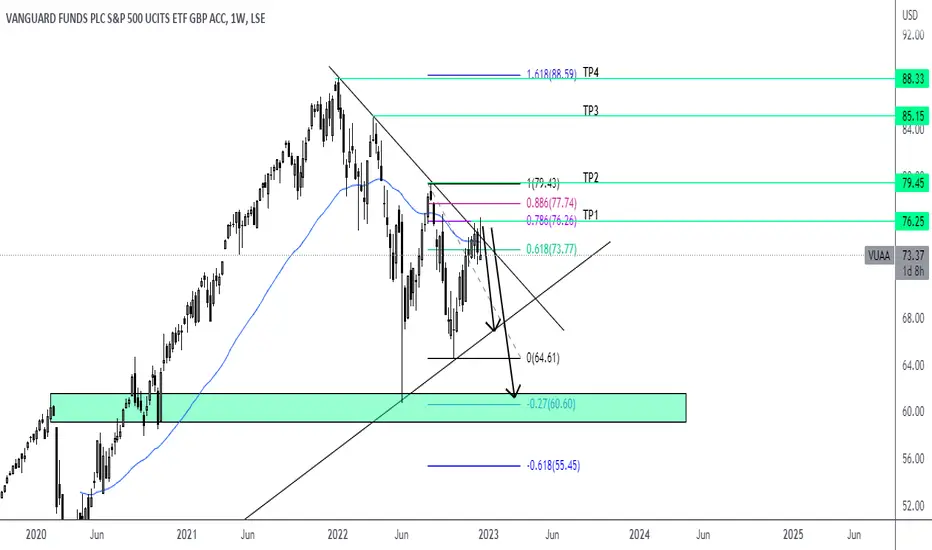
Based on historic PA we can see the clear trend (UP).
However with the current economic situation, covid, war etc... stocks are making pullbacks.
Price is currently rejecting top of the bearish channel and could go lower to the trendline, however if Fibonacci is to be respected (Price already rejecting 0.786 level that aligns with the top of the channel) we could see deeper pullback and Fibonacci target for sell -0.27 aligns perfectly with HIGH from the past.
Targets upon pullback are of course each HIGH.
I would like to see price touch the trendline to execute some buys and if we dive lover and respect Fibonacci I will execute buys there as well.
Short term bearish, long term bullish.
Please have in mind that this is WEEKLY chart and analysis is for long term perspective.
This is not a financial advice.
However with the current economic situation, covid, war etc... stocks are making pullbacks.
Price is currently rejecting top of the bearish channel and could go lower to the trendline, however if Fibonacci is to be respected (Price already rejecting 0.786 level that aligns with the top of the channel) we could see deeper pullback and Fibonacci target for sell -0.27 aligns perfectly with HIGH from the past.
Targets upon pullback are of course each HIGH.
I would like to see price touch the trendline to execute some buys and if we dive lover and respect Fibonacci I will execute buys there as well.
Short term bearish, long term bullish.
Please have in mind that this is WEEKLY chart and analysis is for long term perspective.
This is not a financial advice.

면책사항
해당 정보와 게시물은 금융, 투자, 트레이딩 또는 기타 유형의 조언이나 권장 사항으로 간주되지 않으며, 트레이딩뷰에서 제공하거나 보증하는 것이 아닙니다. 자세한 내용은 이용 약관을 참조하세요.
면책사항
해당 정보와 게시물은 금융, 투자, 트레이딩 또는 기타 유형의 조언이나 권장 사항으로 간주되지 않으며, 트레이딩뷰에서 제공하거나 보증하는 것이 아닙니다. 자세한 내용은 이용 약관을 참조하세요.