
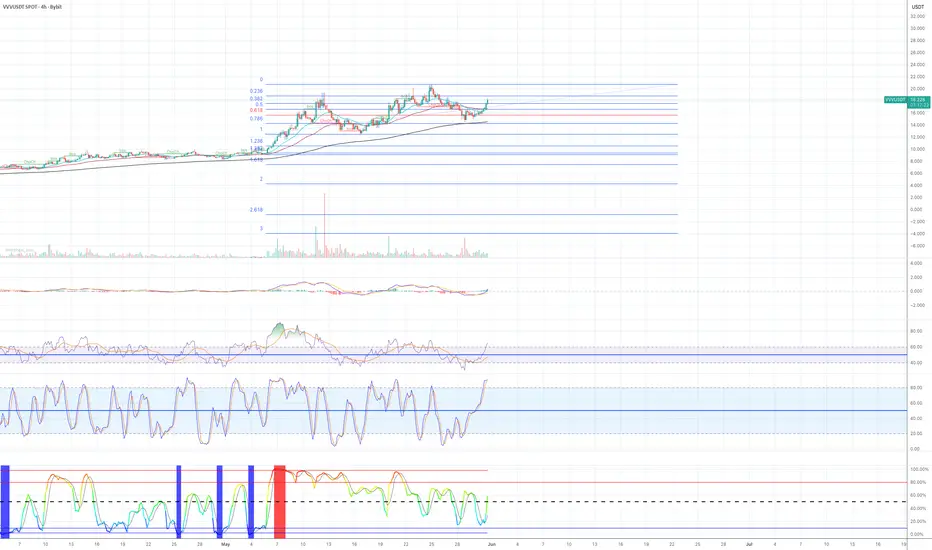
The price is continuing to form a bullish market structure, printing a series of higher highs and higher lows. After pulling back to the 0.786 Fibonacci retracement level and the EMA 200, it found strong support and is now rebounding aggressively.
Volatility,, BBWP, is beginning to expand to the upside, suggesting that a larger directional move may be developing. On the 4-hour chart, both MACD and RSI are entering bullish territory.
As long as the recent higher low remains intact, the bullish structure remains valid. The confluence of support at the 0.786 Fib level, EMA 200, expanding volatility, and improving momentum indicators presents a strong case for continued upside. Overall, the setup looks very bullish.
I bought some VVV this morning based on the technical set up.
Volatility,, BBWP, is beginning to expand to the upside, suggesting that a larger directional move may be developing. On the 4-hour chart, both MACD and RSI are entering bullish territory.
As long as the recent higher low remains intact, the bullish structure remains valid. The confluence of support at the 0.786 Fib level, EMA 200, expanding volatility, and improving momentum indicators presents a strong case for continued upside. Overall, the setup looks very bullish.
I bought some VVV this morning based on the technical set up.
액티브 트레이드
P.S. I am also paying attention to the daily chart. The currently the price is trading within an ascending parallel channel. Althought th price has formed a higher high, both the daily RSI and Stochastic have developed negative divergence, suggesting that bullish momentum may be weakening. If the daily momentum indicators begin to roll over, and the price fails to break and close above 19.437 area, I plan to close my position. 
관련 발행물
면책사항
해당 정보와 게시물은 금융, 투자, 트레이딩 또는 기타 유형의 조언이나 권장 사항으로 간주되지 않으며, 트레이딩뷰에서 제공하거나 보증하는 것이 아닙니다. 자세한 내용은 이용 약관을 참조하세요.
관련 발행물
면책사항
해당 정보와 게시물은 금융, 투자, 트레이딩 또는 기타 유형의 조언이나 권장 사항으로 간주되지 않으며, 트레이딩뷰에서 제공하거나 보증하는 것이 아닙니다. 자세한 내용은 이용 약관을 참조하세요.