
Hey all,
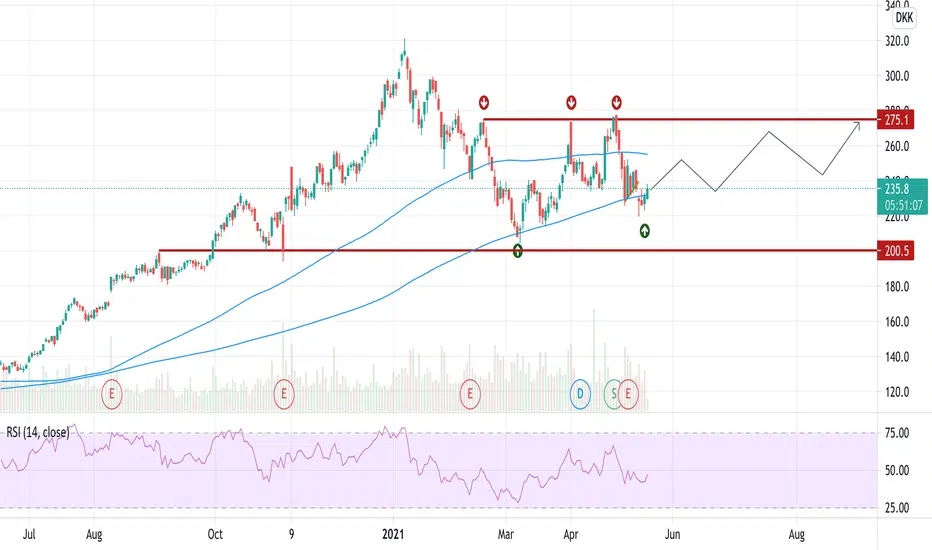
Since recovering from it's multi-month sell off, Vestas found strong support in early March at the 200-day MA, and has since been consolidating within a moving average "trap zone".
I have observed this pattern previously and on daily time frames, this sort of "coiling" will bring to a strong move up or down once the trap narrows, RSI seems to be developing a wedge pattern also, needing to chose a direction for the months to come.
VWS is currently trading below the 20, 50 and 100-day moving average, but has found support again at the 200-day MA recently.
I like this set up, although I would preferably be watching for a breakout above 275DKK for confirmation.
Downside risk is probably around the 200DKK mark.
Any thoughts?
Good luck!
(*This is not financial advice, for sake of discussion and illustrative purposes only*)

면책사항
해당 정보와 게시물은 금융, 투자, 트레이딩 또는 기타 유형의 조언이나 권장 사항으로 간주되지 않으며, 트레이딩뷰에서 제공하거나 보증하는 것이 아닙니다. 자세한 내용은 이용 약관을 참조하세요.
면책사항
해당 정보와 게시물은 금융, 투자, 트레이딩 또는 기타 유형의 조언이나 권장 사항으로 간주되지 않으며, 트레이딩뷰에서 제공하거나 보증하는 것이 아닙니다. 자세한 내용은 이용 약관을 참조하세요.