 W
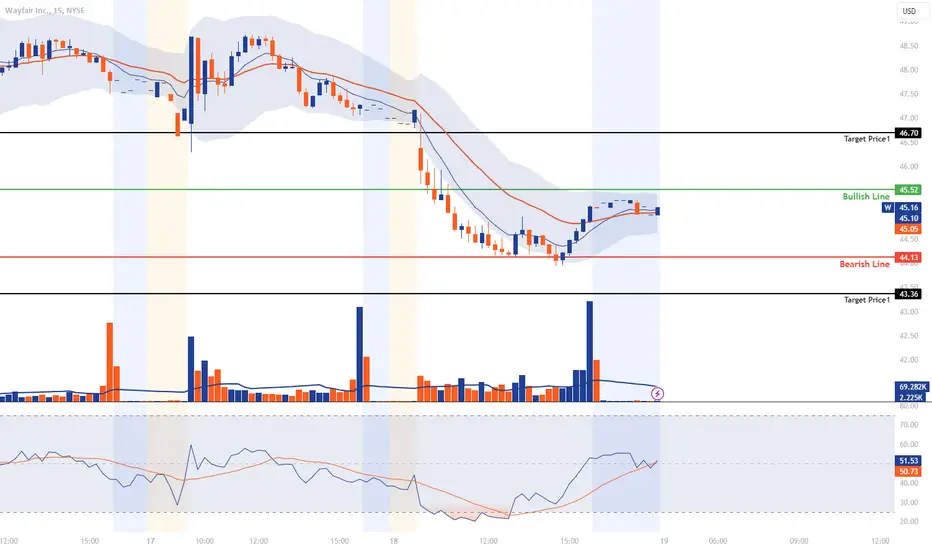
Wayfair Inc. (NYSE: W)
Trend and Moving Averages:
The stock price seems to be trading below its moving averages, indicating a prevailing bearish sentiment.
However, there's a recent upward movement, suggesting a potential bullish reversal.
Support and Resistance:
Bullish Line: Around $45.52, which seems to be a short-term support line the stock is currently trying to maintain.
Bearish Line: At $44.13, acting as the next support below.
Target Price 1: The bearish target is set at $43.36.
Target Price 2: The bullish target is marked at $46.70.
Volume:
There are some significant volume spikes, which can be considered bullish if they coincide with the upward price movements.
RSI (Relative Strength Index):
The RSI line seems to be on the rise, hovering around the mid-line (50). This suggests a balance between buying and selling pressure, with a slight tilt towards a bullish momentum.
MACD (Moving Average Convergence Divergence):
The MACD line has recently crossed above the signal line, which is a bullish signal. The positive divergence indicates increasing bullish momentum.
Observation:
The stock seems to be showing signs of a potential bullish reversal, as indicated by the recent upward trend and the bullish signals from the MACD.
If the stock can maintain its position above the bullish line at $45.52 and witness increased buying volume, it may attempt to reach the target price of $46.70.
Conversely, if it breaks below the bullish line, the next support at the bearish line ($44.13) will be crucial to watch.
거래청산: 타겟 닿음

no pain, no gain
Unveiling illusions, revealing wealth
Unveiling illusions, revealing wealth
면책사항
해당 정보와 게시물은 금융, 투자, 트레이딩 또는 기타 유형의 조언이나 권장 사항으로 간주되지 않으며, 트레이딩뷰에서 제공하거나 보증하는 것이 아닙니다. 자세한 내용은 이용 약관을 참조하세요.
no pain, no gain
Unveiling illusions, revealing wealth
Unveiling illusions, revealing wealth
면책사항
해당 정보와 게시물은 금융, 투자, 트레이딩 또는 기타 유형의 조언이나 권장 사항으로 간주되지 않으며, 트레이딩뷰에서 제공하거나 보증하는 것이 아닙니다. 자세한 내용은 이용 약관을 참조하세요.