롱
WAVES-BTC Trade Idea
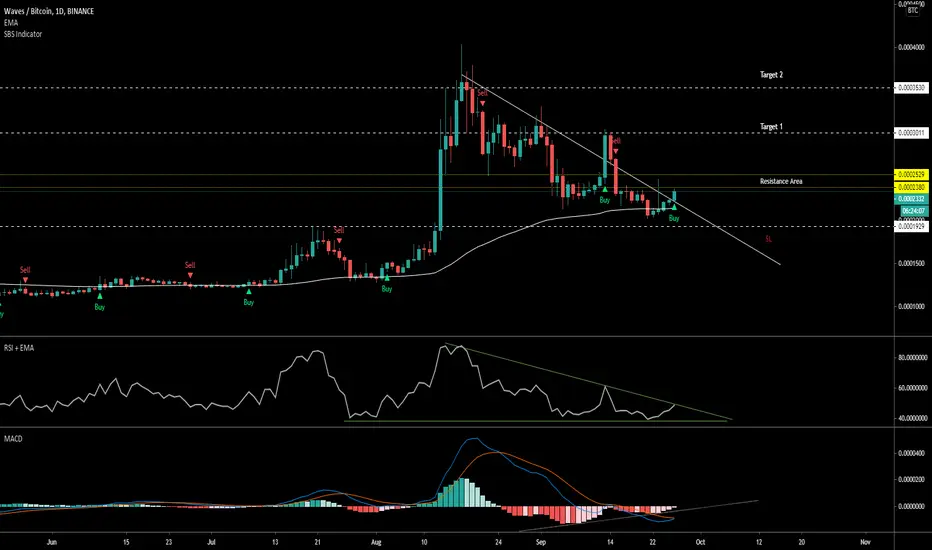
WAVES is breaking out of the trend Line on Daily TF
There is small resistance (Yellow Line) at the Breakout. Break out with good volume will reach Target 1
EMA 89 is acting as a support.
RSI is rising and breakout of the trendline which is acting a diagonal resistance.
MACD is about to cross bullish on Daily chart
MACD histogram is showing Bullish Divergence
SBS Indicator is signaling BUY on Daily chart
Target and SL are on the chart.
Lets see how this plays out.
거래청산: 타겟 닿음
All targets reached
Tip Jar
PayPal - paypal.me/vickyprudhvi
PayPal - paypal.me/vickyprudhvi
관련 발행물
면책사항
해당 정보와 게시물은 금융, 투자, 트레이딩 또는 기타 유형의 조언이나 권장 사항으로 간주되지 않으며, 트레이딩뷰에서 제공하거나 보증하는 것이 아닙니다. 자세한 내용은 이용 약관을 참조하세요.
Tip Jar
PayPal - paypal.me/vickyprudhvi
PayPal - paypal.me/vickyprudhvi
관련 발행물
면책사항
해당 정보와 게시물은 금융, 투자, 트레이딩 또는 기타 유형의 조언이나 권장 사항으로 간주되지 않으며, 트레이딩뷰에서 제공하거나 보증하는 것이 아닙니다. 자세한 내용은 이용 약관을 참조하세요.