Long
WAVES Bullish Flag (Potentially 40% UP)
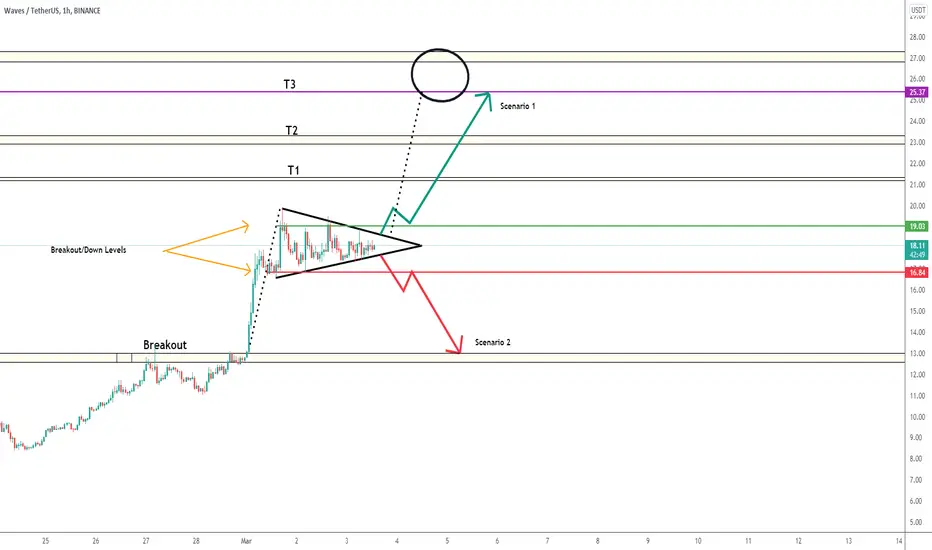
Waves broke the resistance at roughly 13 dollars, and now its forming a bull flag.
Scenario 1 - If WAVES managed to break above the resistance line as highlighted, then and on the balance of probabilities, it is expected that wave will reach the targets illustrated on the chart
Scenario 2 - If waves failed to maintain the support and broke below, I don't see any support to hold it all the way back to the breakout point at roughly 13 dollars
Scenario 1 - If WAVES managed to break above the resistance line as highlighted, then and on the balance of probabilities, it is expected that wave will reach the targets illustrated on the chart
Scenario 2 - If waves failed to maintain the support and broke below, I don't see any support to hold it all the way back to the breakout point at roughly 13 dollars
노트
WAVES broke above the breakout level on the hourly노트
Scenario 1 achieved the first target but currently it has been invalidated Will keep you updated on the Scenario 2 as it is currently reaching the breakdown level
노트
Although the move didn't play exactly as described, as we all know TA is subjective, hence, looking back at the chart, I believe that WAVES was running defined between the two breakout ranges (rather than triangle formation)at the time of posting 2 targets achieved
거래청산: 타겟 닿음
All Targets achieved
면책사항
해당 정보와 게시물은 금융, 투자, 트레이딩 또는 기타 유형의 조언이나 권장 사항으로 간주되지 않으며, 트레이딩뷰에서 제공하거나 보증하는 것이 아닙니다. 자세한 내용은 이용 약관을 참조하세요.
면책사항
해당 정보와 게시물은 금융, 투자, 트레이딩 또는 기타 유형의 조언이나 권장 사항으로 간주되지 않으며, 트레이딩뷰에서 제공하거나 보증하는 것이 아닙니다. 자세한 내용은 이용 약관을 참조하세요.