
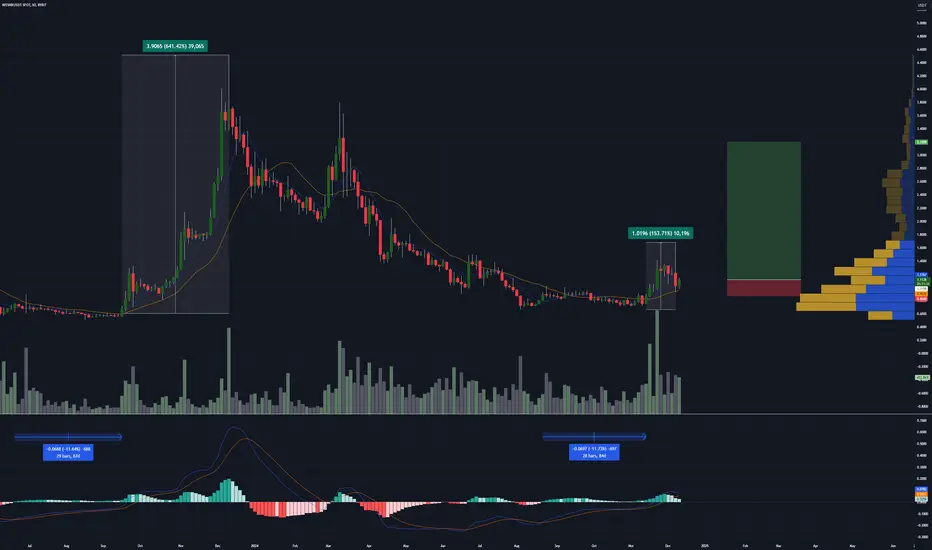
This is a Chart pattern with WEMIX, where we see significant purchases often followed by price drops. For instance, on September 16, 2023, there were 29 bars before a notable price surge, and similarly, on November 14, 2024, a pump occurred after 28 bars.
This raises the question of whether this is a recurring trend?
Leave your comments below
This raises the question of whether this is a recurring trend?
Leave your comments below

면책사항
해당 정보와 게시물은 금융, 투자, 트레이딩 또는 기타 유형의 조언이나 권장 사항으로 간주되지 않으며, 트레이딩뷰에서 제공하거나 보증하는 것이 아닙니다. 자세한 내용은 이용 약관을 참조하세요.
면책사항
해당 정보와 게시물은 금융, 투자, 트레이딩 또는 기타 유형의 조언이나 권장 사항으로 간주되지 않으며, 트레이딩뷰에서 제공하거나 보증하는 것이 아닙니다. 자세한 내용은 이용 약관을 참조하세요.