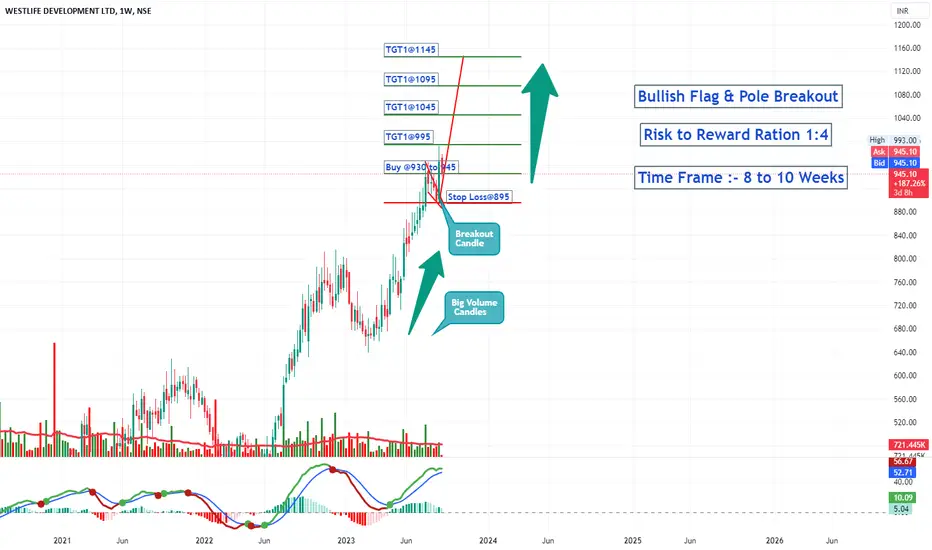
A Bullish Flag and Pole Chart Pattern Breakout happened on the weekly Time frame of  WESTLIFE
Price Action is well supported by the volume.
The stock is currently in uptrend making higher highs and higher lows.
One can add this stock into their stocks to buy list.
Initiate the long trade only according to the levels mentioned.
Stop loss will be on weekly closing basis.
Trend Analysis :- UP Trend
Chart Pattern :- Bullish Flag and Pole
Technical Indicator :- Positive MACD Crossover
WESTLIFE Price Action is well supported by the volume.
The stock is currently in uptrend making higher highs and higher lows.
One can add this stock into their stocks to buy list.
Initiate the long trade only according to the levels mentioned.
Stop loss will be on weekly closing basis.
Trend Analysis :- UP Trend
Chart Pattern :- Bullish Flag and Pole
Technical Indicator :- Positive MACD Crossover
노트
1st Target Achieved.....Enjoy the Money rain Guyssssssssssssssssss
관련 발행물
면책사항
해당 정보와 게시물은 금융, 투자, 트레이딩 또는 기타 유형의 조언이나 권장 사항으로 간주되지 않으며, 트레이딩뷰에서 제공하거나 보증하는 것이 아닙니다. 자세한 내용은 이용 약관을 참조하세요.
면책사항
해당 정보와 게시물은 금융, 투자, 트레이딩 또는 기타 유형의 조언이나 권장 사항으로 간주되지 않으며, 트레이딩뷰에서 제공하거나 보증하는 것이 아닙니다. 자세한 내용은 이용 약관을 참조하세요.