
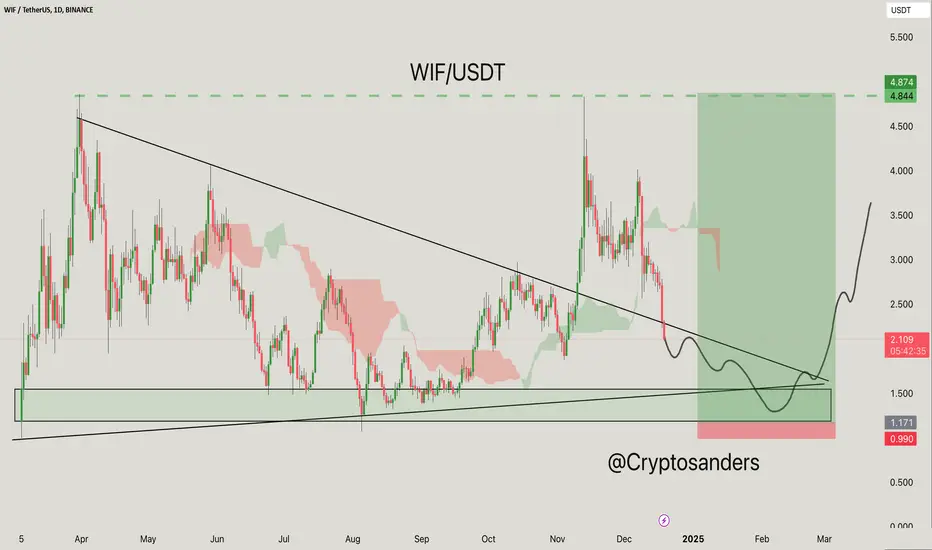
The chart of WIF/USDT shows a potentially bullish setup based on technical analysis.
Descending Triangle Breakout:
The price seems to be approaching the end of the descending triangle, with a potential breakout area of around $2.50.
Support Area:
A significant green area below the current price suggests strong historical support between $0.99 and $1.17.
Ichimoku Cloud:
The behavior of the cloud suggests a transition point, indicating potential bullish momentum if the price breaks above the cloud resistance.
The upward-moving green box shows the long target area of $4.84 to $4.87.
The curve drawn on the chart suggests that the price may fall slightly to the support area before reversing sharply.
Trade Setup:
Entry: Consider buying near the $1.17 support level.
Stop-loss: Place it slightly below $0.99 to manage risk.
Target: Aim at $4.87, which provides a favorable risk-to-profit ratio.
DYOR, NFA
@Peter_CSAdmin

관련 발행물
면책사항
해당 정보와 게시물은 금융, 투자, 트레이딩 또는 기타 유형의 조언이나 권장 사항으로 간주되지 않으며, 트레이딩뷰에서 제공하거나 보증하는 것이 아닙니다. 자세한 내용은 이용 약관을 참조하세요.
관련 발행물
면책사항
해당 정보와 게시물은 금융, 투자, 트레이딩 또는 기타 유형의 조언이나 권장 사항으로 간주되지 않으며, 트레이딩뷰에서 제공하거나 보증하는 것이 아닙니다. 자세한 내용은 이용 약관을 참조하세요.