
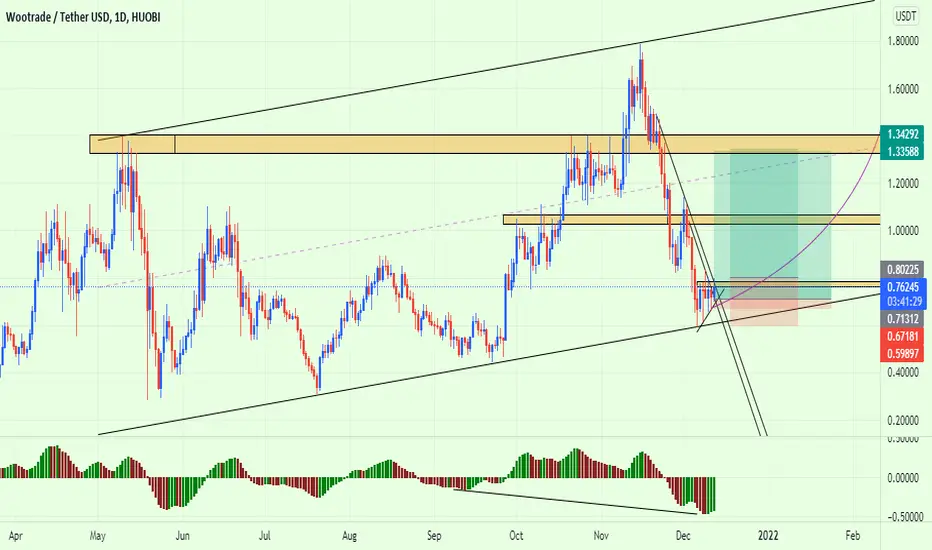
Price is captured within an ASCENDING channel.
On Weekly TF, we can see a bearish momentum candle, slowed down to a DOJI. Also, on closer look, it's all a correction of the "W"
On Daily and H4 timeframes, we can see regular and hidden divergences respectively, CONFLUENCE with lower edge of channel.
Trendline and resistance already broken on H1.
So, I'm in FOR a BULLISH wave.
Price may still retest the lower border of the channel, but that should be the worst- imo.
On Weekly TF, we can see a bearish momentum candle, slowed down to a DOJI. Also, on closer look, it's all a correction of the "W"
On Daily and H4 timeframes, we can see regular and hidden divergences respectively, CONFLUENCE with lower edge of channel.
Trendline and resistance already broken on H1.
So, I'm in FOR a BULLISH wave.
Price may still retest the lower border of the channel, but that should be the worst- imo.

면책사항
해당 정보와 게시물은 금융, 투자, 트레이딩 또는 기타 유형의 조언이나 권장 사항으로 간주되지 않으며, 트레이딩뷰에서 제공하거나 보증하는 것이 아닙니다. 자세한 내용은 이용 약관을 참조하세요.
면책사항
해당 정보와 게시물은 금융, 투자, 트레이딩 또는 기타 유형의 조언이나 권장 사항으로 간주되지 않으며, 트레이딩뷰에서 제공하거나 보증하는 것이 아닙니다. 자세한 내용은 이용 약관을 참조하세요.