롱
WRX/BTC
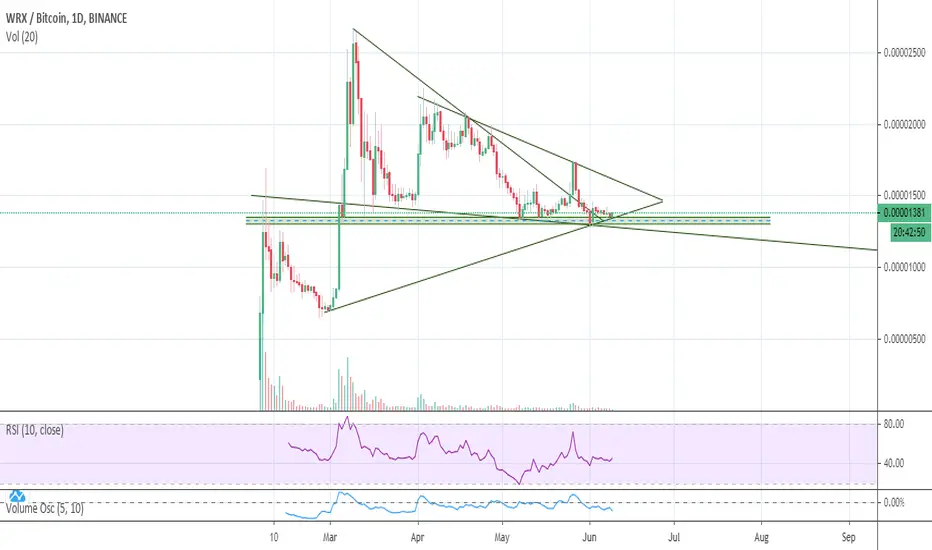
Not an expert. I'm simple, but simple works for me. Buy zone is highlighted just needs some volume to come in. RSI is showing a bullish divergence on the daily.
Break and close below 1270-ish and it's more downside. Break the diagonal trend line and it's more upside!
Break and close below 1270-ish and it's more downside. Break the diagonal trend line and it's more upside!
노트
The diagonal support line that I have drawn is broken, but the horizontal support line is still holding. I'm not sure how this will play out, but I'd certainly be cautious here. If the horizontal line breaks, then there's a lot of space down below. A drop of 50% is certainly not out of the question.Diagonal trend lines are a bit tricky since you can always redraw them to fit your bias.
매매 수동청산
See below for updated chart.
면책사항
해당 정보와 게시물은 금융, 투자, 트레이딩 또는 기타 유형의 조언이나 권장 사항으로 간주되지 않으며, 트레이딩뷰에서 제공하거나 보증하는 것이 아닙니다. 자세한 내용은 이용 약관을 참조하세요.
면책사항
해당 정보와 게시물은 금융, 투자, 트레이딩 또는 기타 유형의 조언이나 권장 사항으로 간주되지 않으며, 트레이딩뷰에서 제공하거나 보증하는 것이 아닙니다. 자세한 내용은 이용 약관을 참조하세요.