
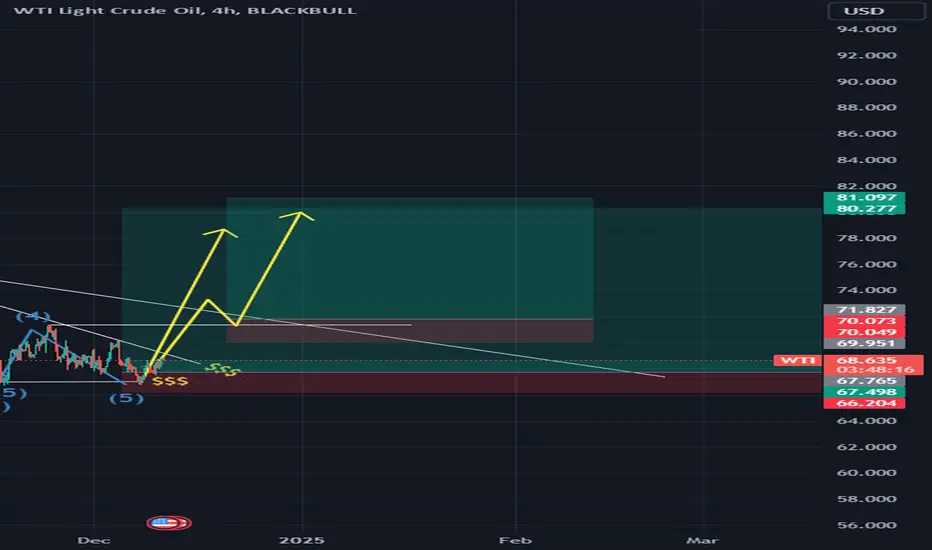
The oil chart is showcasing a large triangle pattern within a smaller triangle, and the breakout of the smaller triangle to the upside strongly suggests that the larger triangle will also be broken. This breakout signals the potential to target significantly higher levels.
Additionally, the bottom has been tested approximately four times, with the last test clearing out all liquidity. Now, the chart appears to be gearing up for a major upward move after a prolonged accumulation phase.
As for my perspective, I’m betting on oil’s rise rather than its decline, even though the current triangle formation is typically a bearish (descending) triangle.
The second entry opportunity will present itself after the larger triangle is broken and confirmed through a retest.
Note: I don't care about the count if it right or not don't comment on that please
액티브 트레이드
if you want to know where to enter see this link it is an update with time and target 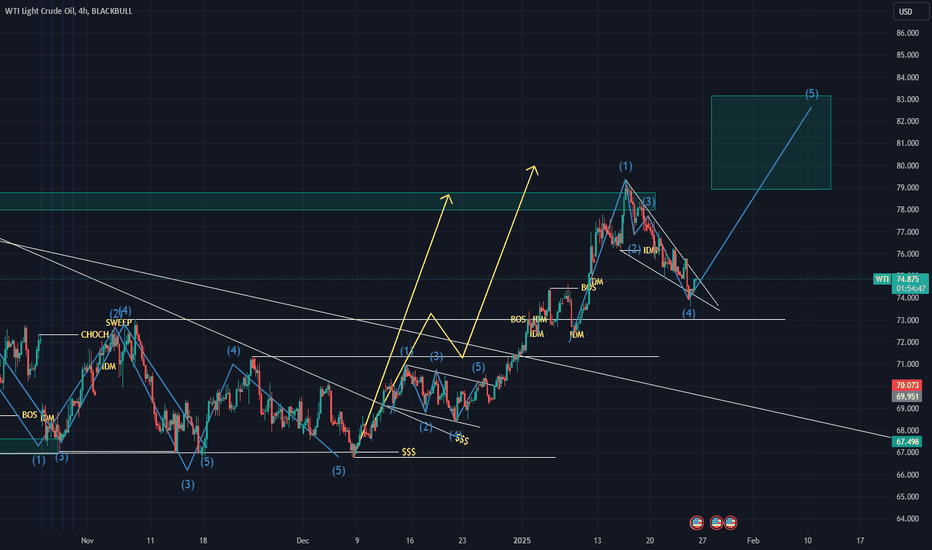
remember sometimes 1 trade is better than 100 trades in a month
this trade has been open 2 months and already took some profit and now going again For long and gets more money

면책사항
해당 정보와 게시물은 금융, 투자, 트레이딩 또는 기타 유형의 조언이나 권장 사항으로 간주되지 않으며, 트레이딩뷰에서 제공하거나 보증하는 것이 아닙니다. 자세한 내용은 이용 약관을 참조하세요.
면책사항
해당 정보와 게시물은 금융, 투자, 트레이딩 또는 기타 유형의 조언이나 권장 사항으로 간주되지 않으며, 트레이딩뷰에서 제공하거나 보증하는 것이 아닙니다. 자세한 내용은 이용 약관을 참조하세요.