
Technical Summary:
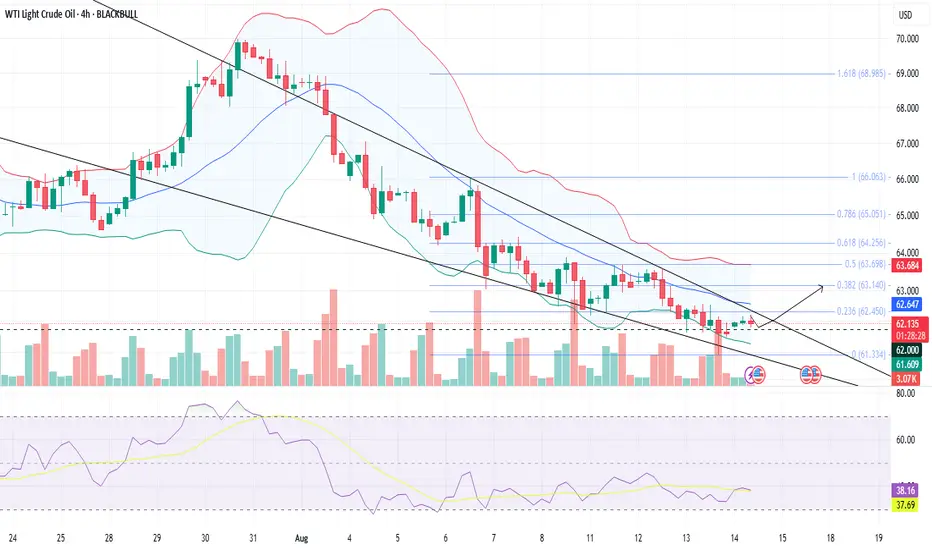
The primary trend of WTI is bearish, and the prices on a 4H chart also continue their downtrend within a declining wedge pattern.
However, prices are retracing after testing the lower fib level 0.0 (61.33) and are currently trending above a crucial psychological & historically tested support of 62.00.
If prices remain able to sustain higher, then it might test important resistance at 63.00, with a near hurdle at the fib level 0.236 (63.45).
Indicator Interpretation:
The prices are rising after testing the lower Bollinger band, signaling a bullish reversal.
Alternate Scenario
If crude oil breaks the crucial support zone between 62.0 - 61.8, then it could signal rising bearish pressure.
Key Levels
Resistance
Support
Facts & Figures:
The world produces about 95–100 million barrels of crude oil per day, with major producers including the U.S., Saudi Arabia, Russia, and Canada.
The primary trend of WTI is bearish, and the prices on a 4H chart also continue their downtrend within a declining wedge pattern.
However, prices are retracing after testing the lower fib level 0.0 (61.33) and are currently trending above a crucial psychological & historically tested support of 62.00.
If prices remain able to sustain higher, then it might test important resistance at 63.00, with a near hurdle at the fib level 0.236 (63.45).
Indicator Interpretation:
The prices are rising after testing the lower Bollinger band, signaling a bullish reversal.
Alternate Scenario
If crude oil breaks the crucial support zone between 62.0 - 61.8, then it could signal rising bearish pressure.
Key Levels
Resistance
- R1 = 62.45
- R2 = 63.15
Support
- S1 = 62.00
- S2 = 61.30
Facts & Figures:
The world produces about 95–100 million barrels of crude oil per day, with major producers including the U.S., Saudi Arabia, Russia, and Canada.

면책사항
해당 정보와 게시물은 금융, 투자, 트레이딩 또는 기타 유형의 조언이나 권장 사항으로 간주되지 않으며, 트레이딩뷰에서 제공하거나 보증하는 것이 아닙니다. 자세한 내용은 이용 약관을 참조하세요.
면책사항
해당 정보와 게시물은 금융, 투자, 트레이딩 또는 기타 유형의 조언이나 권장 사항으로 간주되지 않으며, 트레이딩뷰에서 제공하거나 보증하는 것이 아닙니다. 자세한 내용은 이용 약관을 참조하세요.