
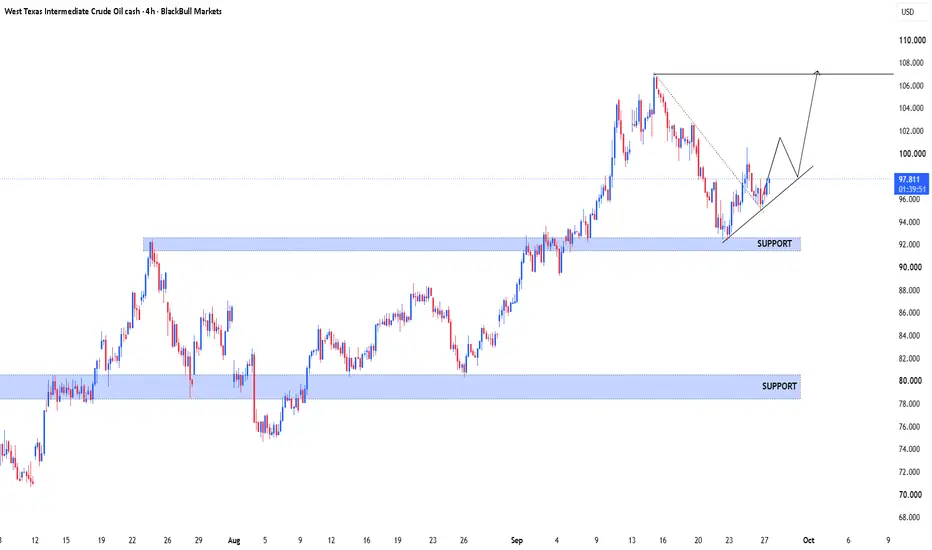
WTI crude oil is maintaining a broader bullish structure on the 4H chart, with price recently pulling back from the 106–107 area and finding support near the 92–93 region.
🔹 Major Support: The 92.0–93.0 zone has acted as an important structural area and is currently supporting the latest recovery.
🔹 Trendline: Price is respecting a rising trendline from the recent low, keeping the short-term structure constructive while it remains intact.
🔹 Current Price Action: WTI is trading around 97.6, with price attempting to build above the rising trendline after the reaction from support.
🔹 Upside Reference: The previous swing-high area around 106–107 remains the major resistance/liquidity reference visible on the chart.
🔹 Secondary Support: If the 92–93 area fails, the broader 78–81 support zone becomes the next major structural reference.
🔎 Structure Scenarios
Bullish scenario:
A sustained move above the recent local highs could indicate continuation toward the previous 106–107 resistance area.
Bearish scenario:
A decisive break below the rising trendline followed by weakness around 92–93 could signal a deeper correction toward lower support.
📌 Key concept: Higher-timeframe support + rising trendline + market structure.
This is an educational technical-analysis study based on the chart shown. It is not financial advice or a trade recommendation. Market conditions can change, so confirmation and independent risk management remain important.
#WTI #CrudeOil #USOIL #PriceAction #MarketStructure #TechnicalAnalysis #SupportResistance #TradingEducation
🔹 Major Support: The 92.0–93.0 zone has acted as an important structural area and is currently supporting the latest recovery.
🔹 Trendline: Price is respecting a rising trendline from the recent low, keeping the short-term structure constructive while it remains intact.
🔹 Current Price Action: WTI is trading around 97.6, with price attempting to build above the rising trendline after the reaction from support.
🔹 Upside Reference: The previous swing-high area around 106–107 remains the major resistance/liquidity reference visible on the chart.
🔹 Secondary Support: If the 92–93 area fails, the broader 78–81 support zone becomes the next major structural reference.
🔎 Structure Scenarios
Bullish scenario:
A sustained move above the recent local highs could indicate continuation toward the previous 106–107 resistance area.
Bearish scenario:
A decisive break below the rising trendline followed by weakness around 92–93 could signal a deeper correction toward lower support.
📌 Key concept: Higher-timeframe support + rising trendline + market structure.
This is an educational technical-analysis study based on the chart shown. It is not financial advice or a trade recommendation. Market conditions can change, so confirmation and independent risk management remain important.
#WTI #CrudeOil #USOIL #PriceAction #MarketStructure #TechnicalAnalysis #SupportResistance #TradingEducation

Join our Telegram channel for Forex & Gold education, market analysis, and free trading updates: t.me/+viwHvBPrtxwxZmE0
Join our Telegram channel for 3–5 daily Gold signals and professional market.
t.me/+viwHvBPrtxwxZmE0
Join our Telegram channel for 3–5 daily Gold signals and professional market.
t.me/+viwHvBPrtxwxZmE0
면책사항
해당 정보와 게시물은 금융, 투자, 트레이딩 또는 기타 유형의 조언이나 권장 사항으로 간주되지 않으며, 트레이딩뷰에서 제공하거나 보증하는 것이 아닙니다. 자세한 내용은 이용 약관을 참조하세요.
Join our Telegram channel for Forex & Gold education, market analysis, and free trading updates: t.me/+viwHvBPrtxwxZmE0
Join our Telegram channel for 3–5 daily Gold signals and professional market.
t.me/+viwHvBPrtxwxZmE0
Join our Telegram channel for 3–5 daily Gold signals and professional market.
t.me/+viwHvBPrtxwxZmE0
면책사항
해당 정보와 게시물은 금융, 투자, 트레이딩 또는 기타 유형의 조언이나 권장 사항으로 간주되지 않으며, 트레이딩뷰에서 제공하거나 보증하는 것이 아닙니다. 자세한 내용은 이용 약관을 참조하세요.