
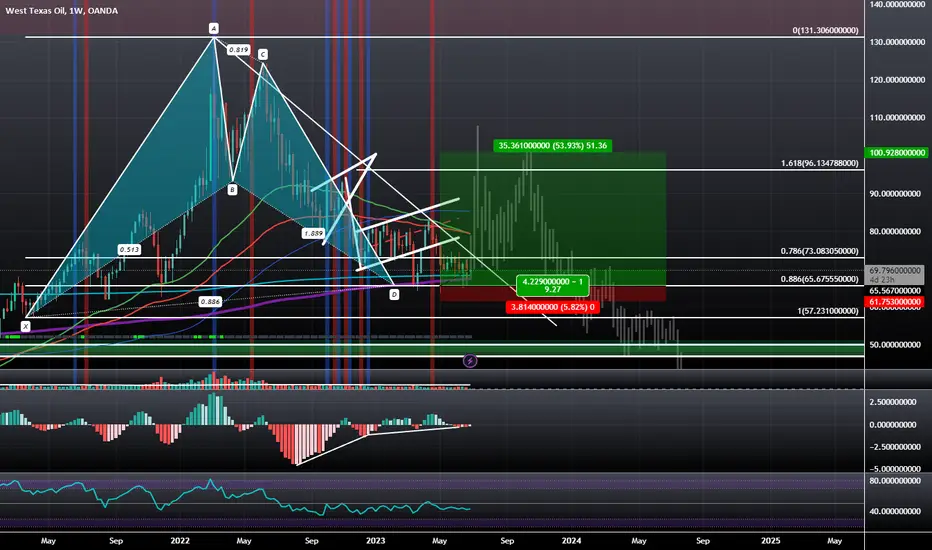
We have a Triple MACD Bullish Divergence at the PCZ of a Bullish Bat that happens to align with the 200-Week SMA and the 800-Week EMA. I have generally been bearish on this chart since the highs back in 2022: tradingview.com/chart/WTICOUSD/YsLzMLja-WTICO-Reversing-at-PCZ-of-Bearish-Shark-on-the-Monthly/, but the persistence it's shown at this Harmonic and Technical level of confluence makes it hard to ignore the potential for at least a 50% move up back to the level of $100.
The 1.618 is at the level of $96.13 but usually if price gets that close to $100, the asset ends up hitting $100, so my target will be $100.
I do think that after it hits the level of $100, it will likely come back down and continue the bearish trend all the way down to even $10, but in the meantime, it looks like there is a decent chance of a short-term rally, which in this case happens to be about a 50% move up from the current level.
The 1.618 is at the level of $96.13 but usually if price gets that close to $100, the asset ends up hitting $100, so my target will be $100.
I do think that after it hits the level of $100, it will likely come back down and continue the bearish trend all the way down to even $10, but in the meantime, it looks like there is a decent chance of a short-term rally, which in this case happens to be about a 50% move up from the current level.
거래청산: 타겟 닿음
Closing this trade early at a profit due to the newly formed Bearish pattern seen here: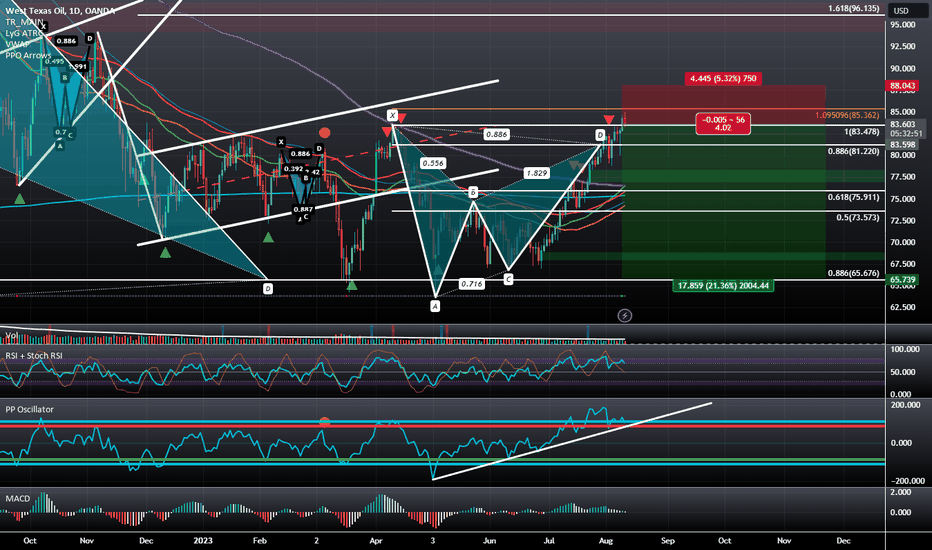

관련 발행물
면책사항
해당 정보와 게시물은 금융, 투자, 트레이딩 또는 기타 유형의 조언이나 권장 사항으로 간주되지 않으며, 트레이딩뷰에서 제공하거나 보증하는 것이 아닙니다. 자세한 내용은 이용 약관을 참조하세요.
관련 발행물
면책사항
해당 정보와 게시물은 금융, 투자, 트레이딩 또는 기타 유형의 조언이나 권장 사항으로 간주되지 않으며, 트레이딩뷰에서 제공하거나 보증하는 것이 아닙니다. 자세한 내용은 이용 약관을 참조하세요.