
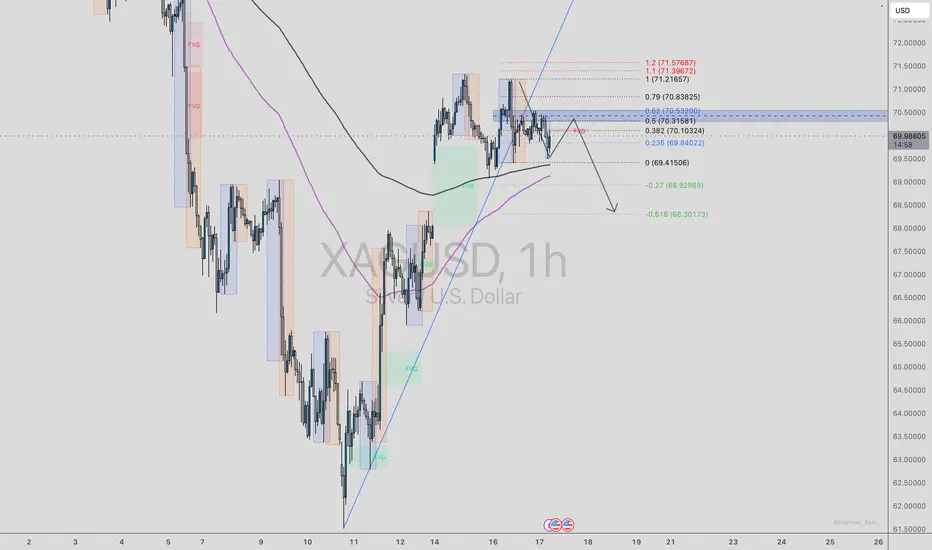
XAG/USD has been in a strong bullish recovery from the June 11 low near the 61.50–62.00 area, pushing aggressively into the 71.21 region. During that move, price respected a clean ascending trendline and continued printing bullish structure with higher highs and higher lows.
However, the current 1H chart is showing early signs of a possible bearish shift.
Price has now broken below the ascending trendline, which was previously acting as dynamic support throughout the move higher. After the break, price attempted to retrace back upward but struggled inside the key Fibonacci retracement zone.
The major rejection area sits around:
This zone also lines up with prior structure, a marked resistance/FVG area, and the broken trendline region. That gives the setup strong bearish confluence.
From an Elliott Wave perspective, the bullish move from the June 11 low into the June 16 high may represent a completed 5-wave impulse. If that count is correct, the current movement could be the beginning of an A-B-C corrective structure.
Possible wave outlook:
Wave A: Initial selloff from 71.21 into 69.41
Wave B: Corrective bounce into the 70.10–70.53 fib zone
Wave C: Potential continuation lower toward the fib extension targets
The key level to watch is 69.41. A clean break and close below this level would confirm a stronger bearish structure shift and open the door for continuation toward:
Target 1: 68.92
Target 2: 68.30
As long as price remains below the 70.53–70.83 area, my bias remains bearish. If price reclaims that zone and pushes back above 71.21, the bearish setup becomes invalidated.
Bias: Bearish below 70.53
Confirmation: Break below 69.41
Targets: 68.92, then 68.30
Invalidation: Reclaim above 70.83–71.21
This is a clean example of how trendline breaks, Fibonacci retracements, fair value gaps, Elliott Wave structure, and market structure can align to create a high-probability trading idea.
WrightWayInvestments
WrightWayInvestments
WrightWayInvestments
However, the current 1H chart is showing early signs of a possible bearish shift.
Price has now broken below the ascending trendline, which was previously acting as dynamic support throughout the move higher. After the break, price attempted to retrace back upward but struggled inside the key Fibonacci retracement zone.
The major rejection area sits around:
- 0.382 Fib: 70.10
- 0.50 Fib: 70.31
- 0.618 Fib: 70.53
This zone also lines up with prior structure, a marked resistance/FVG area, and the broken trendline region. That gives the setup strong bearish confluence.
From an Elliott Wave perspective, the bullish move from the June 11 low into the June 16 high may represent a completed 5-wave impulse. If that count is correct, the current movement could be the beginning of an A-B-C corrective structure.
Possible wave outlook:
Wave A: Initial selloff from 71.21 into 69.41
Wave B: Corrective bounce into the 70.10–70.53 fib zone
Wave C: Potential continuation lower toward the fib extension targets
The key level to watch is 69.41. A clean break and close below this level would confirm a stronger bearish structure shift and open the door for continuation toward:
Target 1: 68.92
Target 2: 68.30
As long as price remains below the 70.53–70.83 area, my bias remains bearish. If price reclaims that zone and pushes back above 71.21, the bearish setup becomes invalidated.
Bias: Bearish below 70.53
Confirmation: Break below 69.41
Targets: 68.92, then 68.30
Invalidation: Reclaim above 70.83–71.21
This is a clean example of how trendline breaks, Fibonacci retracements, fair value gaps, Elliott Wave structure, and market structure can align to create a high-probability trading idea.
WrightWayInvestments
WrightWayInvestments
WrightWayInvestments

💎 FREE FOREX and CRYPTO Signals: t.me/WWInvestmentsFree
🌐 Website: linktr.ee/WrightWayInvestments
🌐 Website: linktr.ee/WrightWayInvestments
면책사항
해당 정보와 게시물은 금융, 투자, 트레이딩 또는 기타 유형의 조언이나 권장 사항으로 간주되지 않으며, 트레이딩뷰에서 제공하거나 보증하는 것이 아닙니다. 자세한 내용은 이용 약관을 참조하세요.
💎 FREE FOREX and CRYPTO Signals: t.me/WWInvestmentsFree
🌐 Website: linktr.ee/WrightWayInvestments
🌐 Website: linktr.ee/WrightWayInvestments
면책사항
해당 정보와 게시물은 금융, 투자, 트레이딩 또는 기타 유형의 조언이나 권장 사항으로 간주되지 않으며, 트레이딩뷰에서 제공하거나 보증하는 것이 아닙니다. 자세한 내용은 이용 약관을 참조하세요.