Long
GOLD 4H CHART ROUTE MAP ANALYSIS
Hello Traders,
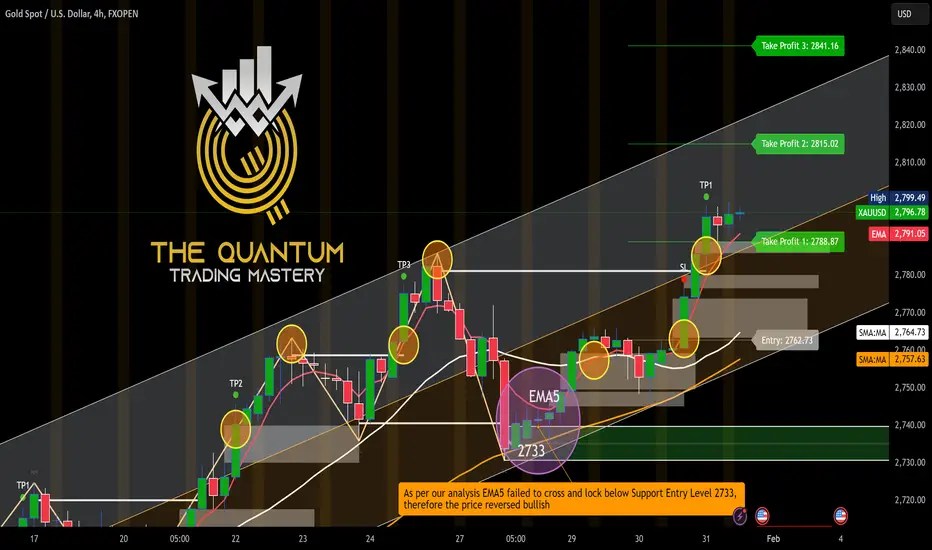
Here’s our updated 4H GOLD analysis. To fully grasp this setup, we highly recommend reviewing our previous 4H chart and carefully reading its caption for a complete context.
Key Breakdown:
Previously, we marked KEY LEVEL 2733 as a crucial support zone. Our strategy was straightforward:
If EMA5 crossed and locked below 2733, we would shift our focus to bearish targets.
If EMA5 crossed and locked above 2733, we would pivot towards bullish targets.
That’s exactly what happened! If you look at the purple circle at the center of the chart, you’ll notice how EMA5 successfully reversed from our 2733 support, triggering a strong bullish momentum.
Recent Performance & Target Updates:
✅ First Bullish Phase:
Buying at the dip allowed us to hit TP1 (2758) and TP2 (2765) twice.
A new Entry Level at 2762 was established.
That entry successfully achieved TP1 (2788)
🚀 Next in Line:
TP2 (2815) and TP3 (2841) is on its way—stay patient and watch price action unfold!
Why This Matters:
This is the power of structured trading. Every move is carefully mapped out, ensuring we trade with precision and patience. However, it’s crucial to read the captions thoroughly to fully understand the setups—missing key details could lead to misinterpretation of the chart.
What’s Next?
📌 We’ll be back on Sunday afternoon with the next GOLD ROUTE MAP for the upcoming week!
🔥 Support us by commenting, liking, and boosting our chart. Your engagement helps us continue providing high-quality analysis!
Looking forward to hearing your thoughts!
Trade smart, stay patient, and trust the process!
— Quantum Trading Master
Here’s our updated 4H GOLD analysis. To fully grasp this setup, we highly recommend reviewing our previous 4H chart and carefully reading its caption for a complete context.
Key Breakdown:
Previously, we marked KEY LEVEL 2733 as a crucial support zone. Our strategy was straightforward:
If EMA5 crossed and locked below 2733, we would shift our focus to bearish targets.
If EMA5 crossed and locked above 2733, we would pivot towards bullish targets.
That’s exactly what happened! If you look at the purple circle at the center of the chart, you’ll notice how EMA5 successfully reversed from our 2733 support, triggering a strong bullish momentum.
Recent Performance & Target Updates:
✅ First Bullish Phase:
Buying at the dip allowed us to hit TP1 (2758) and TP2 (2765) twice.
A new Entry Level at 2762 was established.
That entry successfully achieved TP1 (2788)
🚀 Next in Line:
TP2 (2815) and TP3 (2841) is on its way—stay patient and watch price action unfold!
Why This Matters:
This is the power of structured trading. Every move is carefully mapped out, ensuring we trade with precision and patience. However, it’s crucial to read the captions thoroughly to fully understand the setups—missing key details could lead to misinterpretation of the chart.
What’s Next?
📌 We’ll be back on Sunday afternoon with the next GOLD ROUTE MAP for the upcoming week!
🔥 Support us by commenting, liking, and boosting our chart. Your engagement helps us continue providing high-quality analysis!
Looking forward to hearing your thoughts!
Trade smart, stay patient, and trust the process!
— Quantum Trading Master
액티브 트레이드
What an incredible week it has been!
✅ TP1 Achieved
✅ TP2 Achieved
As for TP3, before reaching the target, it has pulled back to the bottom level for a retest. Now, keep an eye on EMA5—if it crosses and locks above TP2 at 2815, it will confirm a move toward TP3 at 2841. However, if it crosses and locks below TP1 at 2788, a short bearish phase may follow. Also, keep in mind that MA21 detachment is due.
거래청산: 타겟 닿음
TP3 Hit successfully 
관련 발행물
면책사항
해당 정보와 게시물은 금융, 투자, 트레이딩 또는 기타 유형의 조언이나 권장 사항으로 간주되지 않으며, 트레이딩뷰에서 제공하거나 보증하는 것이 아닙니다. 자세한 내용은 이용 약관을 참조하세요.
관련 발행물
면책사항
해당 정보와 게시물은 금융, 투자, 트레이딩 또는 기타 유형의 조언이나 권장 사항으로 간주되지 않으며, 트레이딩뷰에서 제공하거나 보증하는 것이 아닙니다. 자세한 내용은 이용 약관을 참조하세요.