
Beyond the Retracement
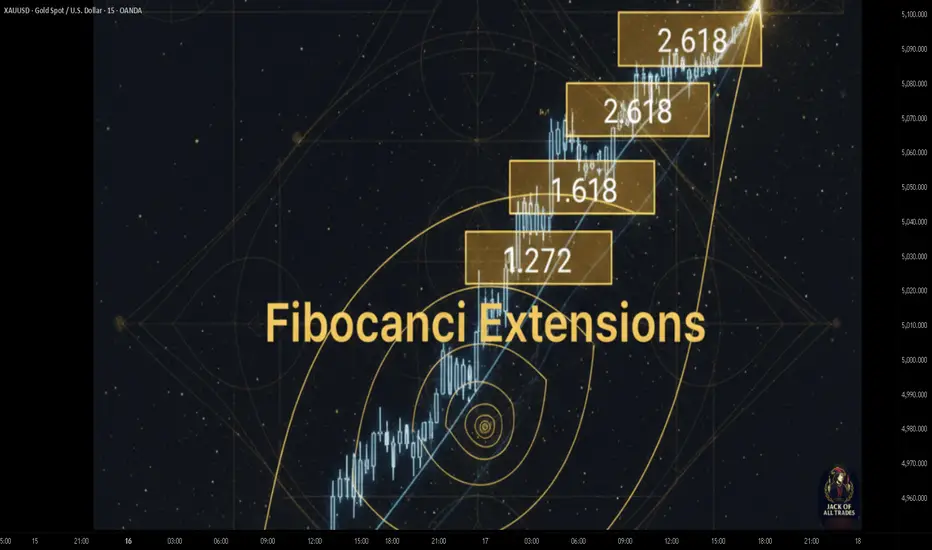
Most traders know Fibonacci retracements (38.2%, 50%, 61.8%). But extensions tell you where price is likely to GO, not just where it might pull back.
Extensions are your roadmap for profit targets.
The Key Extension Levels
1.272 (127.2%):
First major extension. Conservative target. High probability.
1.618 (161.8%):
The golden ratio. Most important level. Primary target for strong trends.
2.0 (200%):
Double the initial move. Psychological and mathematical significance.
2.618 (261.8%):
Extended target. Requires very strong momentum. Less common but powerful.
3.618 and 4.236:
Extreme extensions. Rare but occur in parabolic moves.
How to Draw Extensions
For Uptrend:
1. Point A: Swing low (start of move)
2. Point B: Swing high (end of move)
3. Point C: Retracement low (pullback)
Extension projects upward from Point C.
For Downtrend:
1. Point A: Swing high (start of move)
2. Point B: Swing low (end of move)
3. Point C: Retracement high (bounce)
Extension projects downward from Point C.
Why Fibonacci Works
Mathematical Harmony:
Markets naturally move in proportional waves. Fibonacci ratios appear throughout nature and human behavior.
Self-Fulfilling Prophecy:
Millions of traders watch these levels. Their collective actions create support/resistance.
Institutional Algorithms:
Many trading algorithms use Fibonacci levels for targets and stops.
Trading with Extensions
Strategy 1: Extension Targets
1. Identify completed impulse wave (A to B)
2. Wait for retracement (B to C)
3. Enter on reversal at C
4. First target: 1.272 extension
5. Second target: 1.618 extension
6. Final target: 2.618 extension
Strategy 2: Extension Confluence
1. Draw extensions from multiple swings
2. Find where multiple extensions align
3. These confluence zones are high-probability targets
4. Enter on breakout toward confluence
5. Exit at confluence zone
Strategy 3: Extension Rejection
1. Price reaches major extension (1.618 or 2.618)
2. Shows rejection (reversal candle, volume spike)
3. Enter counter-trend trade
4. Stop beyond extension
5. Target retracement back to previous level
Combining Extensions and Retracements
The Complete Picture:
• Retracements show where to enter
• Extensions show where to exit
Example Trade:
1. Price retraces to 61.8% (entry)
2. Reverses and trends
3. Reaches 1.618 extension (exit)
This is the Fibonacci trader's complete framework.
Multiple Wave Analysis
Wave 1: Initial impulse
Wave 2: Retracement (38.2-61.8%)
Wave 3: Strongest move (often to 1.618 of Wave 1)
Wave 4: Shallow retracement (23.6-38.2%)
Wave 5: Final push (often to 1.618 of Wave 1-3 combined)
Extensions help project where each wave will end.
Time Extensions
Fibonacci applies to time too, not just price.
Key Time Ratios:
If a move takes X days, the next move often takes:
• 0.618X days
• 1.0X days
• 1.618X days
Useful for anticipating when trends might end.
Extension Clusters
When multiple Fibonacci extensions from different swings align at the same price level, that's a high-probability target or reversal zone.
How to Find:
1. Draw extensions from multiple swing points
2. Look for price levels where 2+ extensions converge
3. Mark these as key zones
4. Trade toward or away from these clusters
Common Mistakes[/b>
⚠️ Using extensions without retracements
You need a completed A-B-C pattern. Can't project extensions from just one move.
⚠️ Forcing the levels
Not every move follows Fibonacci perfectly. Use extensions as guides, not guarantees.
⚠️ Ignoring other technical factors
Extensions work best when combined with support/resistance, volume, and trend analysis.
⚠️ Trading every extension
Focus on 1.272 and 1.618. These are the most reliable. Higher extensions require exceptional momentum.
Advanced Techniques
Nested Extensions:
Draw extensions within extensions for precise targets in complex moves.
Extension Channels:
Use extensions to project parallel channel boundaries.
Fibonacci Fans:
Diagonal extensions that project both price and time.
Real-World Application
Scenario: Stock Breakout
1. Stock rallies from $50 to $70 (A to B)
2. Pulls back to $62 (C) - 61.8% retracement
3. You enter long at $62
4. First target: $74 (1.272 extension)
5. Second target: $82 (1.618 extension)
6. Final target: $94 (2.618 extension)
You now have a complete trade plan with multiple targets.
Combining with Other Tools
Extensions + Volume Profile:
Look for extensions that align with high volume nodes.
Extensions + Moving Averages:
Extensions near major MAs create strong confluence.
Extensions + Round Numbers:
1.618 extension at $100 is more significant than at $97.43.
Key Takeaways
• Extensions project where price is likely to go
• Key levels: 1.272, 1.618, 2.0, 2.618
• Need completed A-B-C pattern to draw extensions
• 1.618 is the golden ratio and most important level
• Use extensions for profit targets, not just entries
• Confluence of multiple extensions creates high-probability zones
• Combine with retracements for complete trading framework
• Works across all timeframes and markets
Your Turn
Do you use Fibonacci extensions for your profit targets? What's been your experience with the 1.618 level?
Share your Fibonacci stories below 👇
Most traders know Fibonacci retracements (38.2%, 50%, 61.8%). But extensions tell you where price is likely to GO, not just where it might pull back.
Extensions are your roadmap for profit targets.
The Key Extension Levels
1.272 (127.2%):
First major extension. Conservative target. High probability.
1.618 (161.8%):
The golden ratio. Most important level. Primary target for strong trends.
2.0 (200%):
Double the initial move. Psychological and mathematical significance.
2.618 (261.8%):
Extended target. Requires very strong momentum. Less common but powerful.
3.618 and 4.236:
Extreme extensions. Rare but occur in parabolic moves.
How to Draw Extensions
For Uptrend:
1. Point A: Swing low (start of move)
2. Point B: Swing high (end of move)
3. Point C: Retracement low (pullback)
Extension projects upward from Point C.
For Downtrend:
1. Point A: Swing high (start of move)
2. Point B: Swing low (end of move)
3. Point C: Retracement high (bounce)
Extension projects downward from Point C.
Why Fibonacci Works
Mathematical Harmony:
Markets naturally move in proportional waves. Fibonacci ratios appear throughout nature and human behavior.
Self-Fulfilling Prophecy:
Millions of traders watch these levels. Their collective actions create support/resistance.
Institutional Algorithms:
Many trading algorithms use Fibonacci levels for targets and stops.
Trading with Extensions
Strategy 1: Extension Targets
1. Identify completed impulse wave (A to B)
2. Wait for retracement (B to C)
3. Enter on reversal at C
4. First target: 1.272 extension
5. Second target: 1.618 extension
6. Final target: 2.618 extension
Strategy 2: Extension Confluence
1. Draw extensions from multiple swings
2. Find where multiple extensions align
3. These confluence zones are high-probability targets
4. Enter on breakout toward confluence
5. Exit at confluence zone
Strategy 3: Extension Rejection
1. Price reaches major extension (1.618 or 2.618)
2. Shows rejection (reversal candle, volume spike)
3. Enter counter-trend trade
4. Stop beyond extension
5. Target retracement back to previous level
Combining Extensions and Retracements
The Complete Picture:
• Retracements show where to enter
• Extensions show where to exit
Example Trade:
1. Price retraces to 61.8% (entry)
2. Reverses and trends
3. Reaches 1.618 extension (exit)
This is the Fibonacci trader's complete framework.
Multiple Wave Analysis
Wave 1: Initial impulse
Wave 2: Retracement (38.2-61.8%)
Wave 3: Strongest move (often to 1.618 of Wave 1)
Wave 4: Shallow retracement (23.6-38.2%)
Wave 5: Final push (often to 1.618 of Wave 1-3 combined)
Extensions help project where each wave will end.
Time Extensions
Fibonacci applies to time too, not just price.
Key Time Ratios:
If a move takes X days, the next move often takes:
• 0.618X days
• 1.0X days
• 1.618X days
Useful for anticipating when trends might end.
Extension Clusters
When multiple Fibonacci extensions from different swings align at the same price level, that's a high-probability target or reversal zone.
How to Find:
1. Draw extensions from multiple swing points
2. Look for price levels where 2+ extensions converge
3. Mark these as key zones
4. Trade toward or away from these clusters
Common Mistakes[/b>
⚠️ Using extensions without retracements
You need a completed A-B-C pattern. Can't project extensions from just one move.
⚠️ Forcing the levels
Not every move follows Fibonacci perfectly. Use extensions as guides, not guarantees.
⚠️ Ignoring other technical factors
Extensions work best when combined with support/resistance, volume, and trend analysis.
⚠️ Trading every extension
Focus on 1.272 and 1.618. These are the most reliable. Higher extensions require exceptional momentum.
Advanced Techniques
Nested Extensions:
Draw extensions within extensions for precise targets in complex moves.
Extension Channels:
Use extensions to project parallel channel boundaries.
Fibonacci Fans:
Diagonal extensions that project both price and time.
Real-World Application
Scenario: Stock Breakout
1. Stock rallies from $50 to $70 (A to B)
2. Pulls back to $62 (C) - 61.8% retracement
3. You enter long at $62
4. First target: $74 (1.272 extension)
5. Second target: $82 (1.618 extension)
6. Final target: $94 (2.618 extension)
You now have a complete trade plan with multiple targets.
Combining with Other Tools
Extensions + Volume Profile:
Look for extensions that align with high volume nodes.
Extensions + Moving Averages:
Extensions near major MAs create strong confluence.
Extensions + Round Numbers:
1.618 extension at $100 is more significant than at $97.43.
Key Takeaways
• Extensions project where price is likely to go
• Key levels: 1.272, 1.618, 2.0, 2.618
• Need completed A-B-C pattern to draw extensions
• 1.618 is the golden ratio and most important level
• Use extensions for profit targets, not just entries
• Confluence of multiple extensions creates high-probability zones
• Combine with retracements for complete trading framework
• Works across all timeframes and markets
Your Turn
Do you use Fibonacci extensions for your profit targets? What's been your experience with the 1.618 level?
Share your Fibonacci stories below 👇

The AI Trading Ecosystem, Built to win trades 📈
Get Full Access 👇
jackofalltrades.vip 🌐
t.me/jackofalltradesvip 🃏
Get Full Access 👇
jackofalltrades.vip 🌐
t.me/jackofalltradesvip 🃏
면책사항
해당 정보와 게시물은 금융, 투자, 트레이딩 또는 기타 유형의 조언이나 권장 사항으로 간주되지 않으며, 트레이딩뷰에서 제공하거나 보증하는 것이 아닙니다. 자세한 내용은 이용 약관을 참조하세요.
The AI Trading Ecosystem, Built to win trades 📈
Get Full Access 👇
jackofalltrades.vip 🌐
t.me/jackofalltradesvip 🃏
Get Full Access 👇
jackofalltrades.vip 🌐
t.me/jackofalltradesvip 🃏
면책사항
해당 정보와 게시물은 금융, 투자, 트레이딩 또는 기타 유형의 조언이나 권장 사항으로 간주되지 않으며, 트레이딩뷰에서 제공하거나 보증하는 것이 아닙니다. 자세한 내용은 이용 약관을 참조하세요.