
1.0 Introduction: Moving Beyond Signals to Predictive Analysis 🎯
Many traders find the Ichimoku Kinko Hyo system intimidating, often attributing its complexity to its Japanese terminology 🇯🇵. However, this perception of difficulty stems not from the names of the components, but from a failure to grasp the simple mathematical logic ➗ that governs their movements. When traders understand the precise calculations behind each line, they unlock the system's true potential 🔓 to the point where the indicator on the chart becomes a mere confirmation of what they can already anticipate. The central thesis of this brief is that a deep knowledge of these foundational formulas empowers an analyst to anticipate the future movements of the indicator and, by extension, the price itself 📈. This transforms the Ichimoku system from a reactive signal generator into a proactive analytical framework for forecasting market behavior 🔮.
We will begin by examining the components that define the market's present equilibrium ⚖️.
2.0 The Equilibrium Lines: Gauging Present Market Momentum 📉📈
The strategic core of the Ichimoku system's "present-day" analysis rests on two lines: the Tenkan-sen and the Kijun-sen. These components measure short-term and medium-term price equilibrium, respectively. Understanding their distinct calculation methods is the foundational step toward anticipating shifts in the market's balance of power 💪.
2.1 Tenkan-sen: The Short-Term Momentum Line ⚡
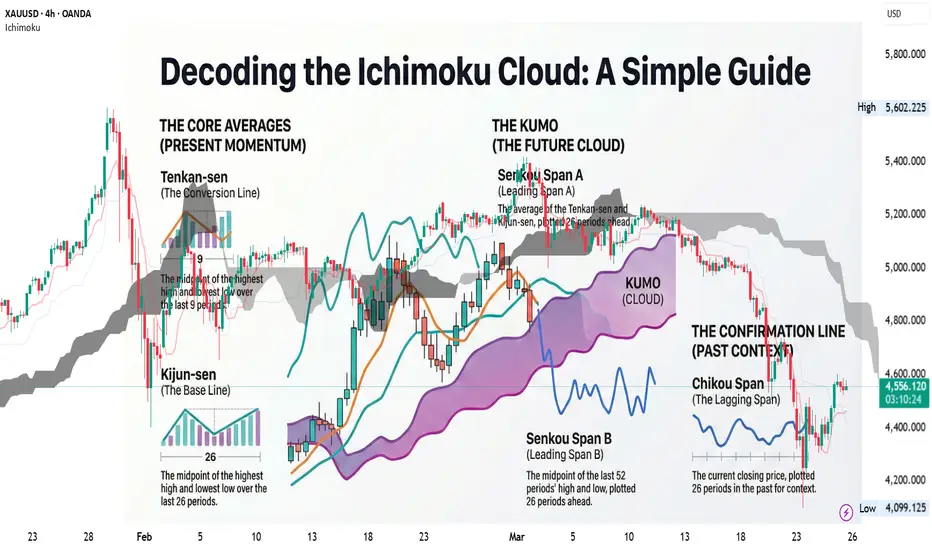
• Calculation Method: The Tenkan-sen is the midpoint of the range defined by the highest high ⬆️ and the lowest low ⬇️ over the past 9️⃣ periods. Visually, if one were to draw a box 📦 around the last 9 candles, the Tenkan-sen represents the exact vertical center of that box.
• Analytical Interpretation: This 9-period look-back makes the Tenkan-sen a high-frequency equilibrium line, highly sensitive to immediate price equilibrium 🎚️. Its rapid response is a direct result of its short calculation window. Therefore, an analyst can anticipate that the Tenkan-sen will only move if price action establishes a new highest high or lowest low within the preceding 9-period window. Its future state is a knowable outcome based on price's relationship to that range 🧮.
2.2 Kijun-sen: The Medium-Term Baseline 🏗️
• Calculation Method: The Kijun-sen uses the same methodology but expands the look-back period. It is the midpoint of the highest high and lowest low over the past 2️⃣6️⃣ periods—the vertical center of a 26-candle box.
• Analytical Interpretation: With its longer 26-period look-back, the Kijun-sen serves as a lower-frequency, more robust baseline of the market's medium-term equilibrium 🎯. This means a strategist knows the Kijun-sen will remain flat ➖ unless a new 26-period high or low is breached, making its stability predictable and its potential turning points identifiable in advance 🔍.
These present-day equilibrium values are not merely reactive indicators; they are the raw data inputs for the Ichimoku system's most powerful feature: the forward-projected Kumo ☁️.
3.0 The Kumo: Projecting Future Market Structure ☁️🔮
The Kumo, or Cloud, is the Ichimoku system's most distinctive and predictive feature. Its analytical power is derived from its unique construction, which projects current and historical equilibrium data 26 periods into the future ⏩. This projection provides a visual forecast of potential future areas of support and resistance, giving traders a glimpse into the anticipated market structure 🏛️.
3.1 Senkou Span A (Leading Span A) 🥇
• Calculation Method: Senkou Span A is calculated by taking the midpoint (average) ➗ of the Tenkan-sen and the Kijun-sen. The resulting value is then plotted 26 periods ahead of the current price action ⏭️.
• Analytical Interpretation: As it is derived from the shorter-term equilibrium lines, Senkou Span A forms the "fast-moving" boundary of the future Kumo 🏃♂️💨. It effectively projects the midpoint of the current equilibrium range into the future. Consequently, its future trajectory is not a mystery ❓; it is the pre-calculated future midpoint of the two present-day equilibrium lines. Any event affecting the Tenkan-sen or Kijun-sen today has a mathematically certain impact on the Kumo's shape 26 periods from now 🎯.
3.2 Senkou Span B (Leading Span B) 🥈
• Calculation Method: Senkou Span B is calculated as the midpoint of the highest high and the lowest low over the past 5️⃣2️⃣ periods. This result is also plotted 26 periods ahead ⏭️.
• Analytical Interpretation: The extensive 52-period look-back makes Senkou Span B the "slow-moving" boundary of the Kumo 🐢 and the most stable component in the system. It represents a projection of long-term market equilibrium. Its static nature can be anticipated; an analyst knows that only a significant, sustained trend that creates a new 52-period high or low will shift this long-term projected boundary 🏔️.
While the Kumo provides a forecast of future market structure, the system's final component offers a crucial layer of historical validation for present price action 📜.
4.0 The Historical Benchmark: The Chikou Span ⏪📊
The Chikou Span, or Lagging Span, serves a unique purpose within the Ichimoku system. It is a tool designed to contextualize current price action within a historical framework 🏛️, offering a clear perspective on existing momentum and trend strength by comparing the present to the recent past 🔄.
4.1 Chikou Span: Price Action in Retrospect 🕰️
• Calculation Method: The Chikou Span's calculation is the simplest of all: it is the current closing price plotted 26 periods in the past ⏮️.
• Analytical Interpretation: This simple backward shift provides a powerful analytical layer 💡. It allows a trader to instantly and visually compare the current price's strength against the market conditions that existed 26 periods prior. This allows for a precise, objective measure of momentum 📏. If the Chikou Span is above the price of 26 periods ago, the current trend is mathematically confirmed as having positive momentum relative to that look-back period ✅📈.
Ultimately, the predictive power of the Ichimoku system emerges not from any single calculation, but from the synthesis of these present, future, and past perspectives into a single, cohesive model 🔗🧩.
5.0 Conclusion: From Calculation to Anticipation 🎓✨
By deconstructing the Ichimoku system into its core calculations, its predictive power becomes clear 🔍💡. The key lies in understanding the specific look-back and plotting periods—9️⃣, 2️⃣6️⃣, and 5️⃣2️⃣—that govern each component. An analyst who internalizes this mathematical architecture can mentally project the future trajectory of the Ichimoku lines based on incoming price data, anticipating how a new high or low will affect the Tenkan-sen, the Kijun-sen, and ultimately the future Kumo 🧠📈. This foundational knowledge elevates the Ichimoku system from a static set of lagging signals to a comprehensive framework for anticipating future market structure, providing a significant analytical edge 🚀🏆.

Queenichi 👑
면책사항
해당 정보와 게시물은 금융, 투자, 트레이딩 또는 기타 유형의 조언이나 권장 사항으로 간주되지 않으며, 트레이딩뷰에서 제공하거나 보증하는 것이 아닙니다. 자세한 내용은 이용 약관을 참조하세요.
Queenichi 👑
면책사항
해당 정보와 게시물은 금융, 투자, 트레이딩 또는 기타 유형의 조언이나 권장 사항으로 간주되지 않으며, 트레이딩뷰에서 제공하거나 보증하는 것이 아닙니다. 자세한 내용은 이용 약관을 참조하세요.