
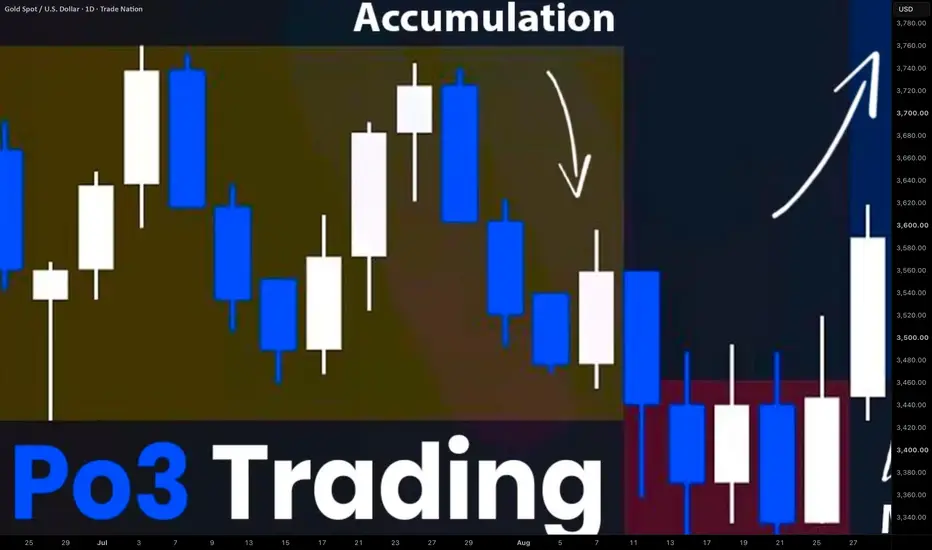
Today, I will teach you how to use Power of 3 model Po3 with multiple time frame analysis on Forex Gold.
I will break down a complete step-by-step trading strategy with examples.
You will learn the best time frames to use, an easy way to spot manipulations, and an accurate entry signal.
Take notes, and let's get started.
The most effective and easiest way to use the Power of 3 concept is trend trading.
Look for the following price action on a daily time frame:
The market should update higher highs and higher lows to confirm an uptrend.
- First, we should wait for a confirmed bullish break of structure BoS.
- Then, we should wait for the start of a correctional movement or a retracement.
We will use Power of 3 Po3 model to predict its completion and buy the market after a pullback.
When the market starts a correction, use a 4H time frame.
On a 4h time frame, each impulse and retracement leg that you identified on a daily time frame will look like a sequence of multiple minor bullish and bearish movements.
In fact, a correctional movement that you see on a daily time frame will be a minor bearish trend on a 4H time frame.
To confirm the completion of this correction and the resumption of a global trend, we will look for Power of 3 model.
- First, the market should start accumulation within a horizontal range.
- Then, a manipulative price movement should follow with a bearish movement going below the lows of the range.
Your strong bullish signal will be a consecutive bullish movement and a breakout of the highs of the accumulation range.
This event will confirm the completion of a correction.
A strong bullish wave will likely follow, and the price will likely reach the current high with a highly probable consecutive bullish break of structure.
- Set your buy limit order on a retest of a broken resistance of the range.
- Set stop loss below the lows of the range.
- Your take profit will be based on the current high.
GBPCHF is trading in a strong uptrend on a daily time frame.
We see a confirmed bullish break of structure with a consecutive pullback.
On a 4H time frame, we see a valid Po3 model with an accumulation within a horizontal range, a manipulation below its lows, and a distribution with a violation of the highs of the range.
This model confirms that a minor bearish trend on a 4H time frame is violated. It indicates a highly probable resumption of a global bullish trend.
That's how a trading position should look using this trading our trading strategy.
If you see that a forex pair is trading in a downtrend on a daily time frame, consistently updating lower highs and lower lows, patiently wait for a bearish break of structure.
Then, let the market start a corrective movement.
Use a 4H time frame to confirm its completion with Power of 3 model.
- Look for the start of a consolidation and accumulation in a minor bullish trend on a 4H.
- Then, wait for a manipulation and a bullish movement above the highs of a consolidation range.
- Your final confirmation will be a breakout of the lows of the range and a 4H candle close below.
This event will confirm a violation of a minor bullish trend.
A strong bearish wave will likely follow, and the price will likely reach the current low with a highly probable consecutive bearish break of structure.
- Set your sell limit order on a retest of the broken support of the range.
- TP will be based on the current low.
- Stop loss will be above the highs of a manipulation.
USDCHF is strongly bearish on a daily time frame.
We see a valid bearish BoS and a pullback.
To predict the start of a new bearish wave, we will look for Po3 model on a 4H.
That is how it looks.
Our signal to sell is a breakout and a 4H candle close below the support of an accumulation range.
- Entry should be on a retest of a broken support of the range.
- TP based on the current low.
- SL above the highs of a manipulation.
And the price reached the goal.
Power of 3 Po3 model works best in trend trading.
A combination of a daily and 4h time frame analysis will help you accurately spot an entry signal.
❤️Please, support my work with like, thank you!❤️
I am part of Trade Nation's Influencer program and receive a monthly fee for using their TradingView charts in my analysis.
노트
Check my new educational article: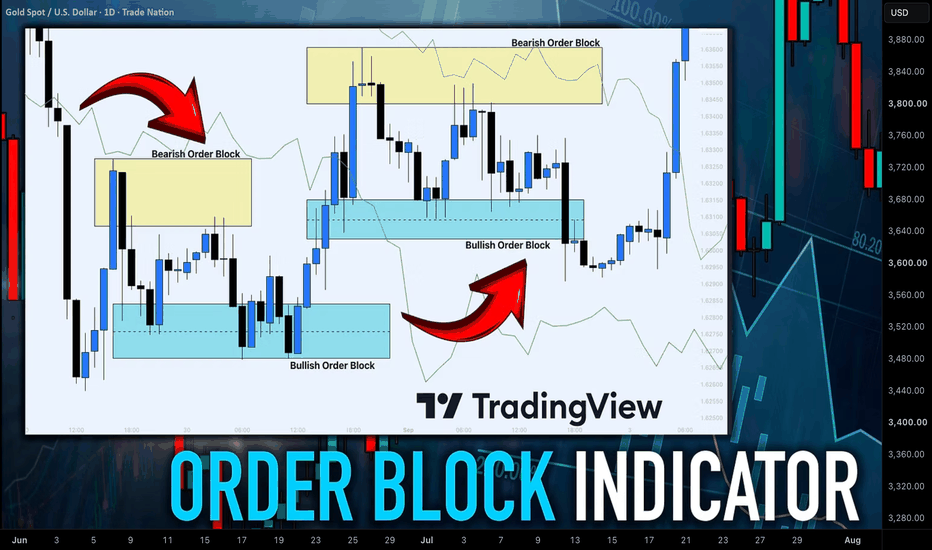

✅My Telegram Channel: t.me/VasilyTrading
❗️YouTube Channel: youtube.com/c/VasilyTrader
✅ Facebook: facebook.com/VasilyTrading/
⭐ Get 100% Deposit Bonus: bit.ly/bestforexgoldbroker
❗️YouTube Channel: youtube.com/c/VasilyTrader
✅ Facebook: facebook.com/VasilyTrading/
⭐ Get 100% Deposit Bonus: bit.ly/bestforexgoldbroker
관련 발행물
면책사항
해당 정보와 게시물은 금융, 투자, 트레이딩 또는 기타 유형의 조언이나 권장 사항으로 간주되지 않으며, 트레이딩뷰에서 제공하거나 보증하는 것이 아닙니다. 자세한 내용은 이용 약관을 참조하세요.
✅My Telegram Channel: t.me/VasilyTrading
❗️YouTube Channel: youtube.com/c/VasilyTrader
✅ Facebook: facebook.com/VasilyTrading/
⭐ Get 100% Deposit Bonus: bit.ly/bestforexgoldbroker
❗️YouTube Channel: youtube.com/c/VasilyTrader
✅ Facebook: facebook.com/VasilyTrading/
⭐ Get 100% Deposit Bonus: bit.ly/bestforexgoldbroker
관련 발행물
면책사항
해당 정보와 게시물은 금융, 투자, 트레이딩 또는 기타 유형의 조언이나 권장 사항으로 간주되지 않으며, 트레이딩뷰에서 제공하거나 보증하는 것이 아닙니다. 자세한 내용은 이용 약관을 참조하세요.