
1. Market Context
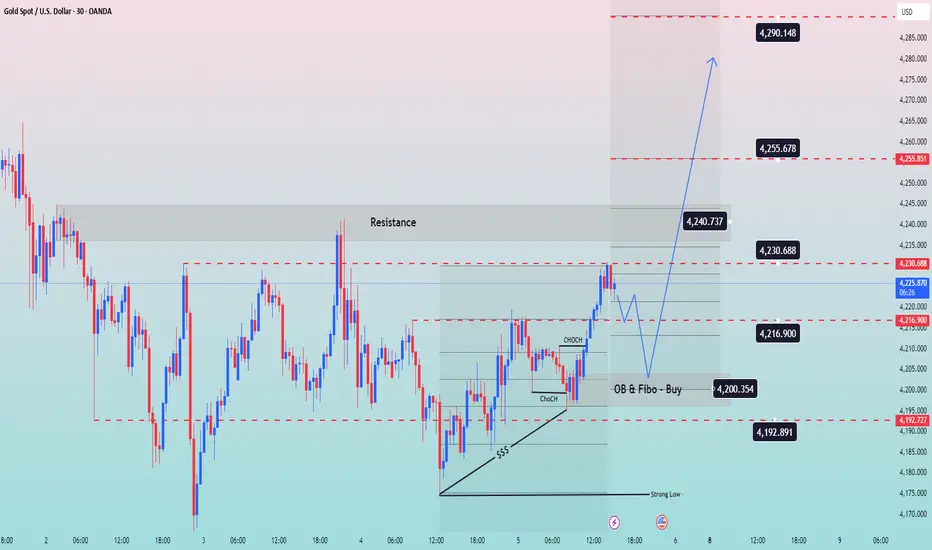
In the M30 timeframe, the price is in a correction phase after forming a strong bottom area around 4,192–4,195. From there, the market has generated a series of positive signals: the price line gradually moves higher, with consecutive CHoCH appearances, indicating weakening selling pressure and a shift in cash flow towards accumulation.
The resistance area of 4,230–4,240 remains a significant barrier. If it is broken with a clear closing candle, the upward structure will be confirmed, and the price may expand to higher areas.
2. Key Price Areas (SMC Mapping)
Upper Resistance
4,230–4,240: strong reaction area, acting as the first barrier.
4,255–4,256: the next expansion area when the upward trend is confirmed.
4,289–4,290: the final target in the expansion structure of the upward wave.
Support Area – Buying Point
4,200–4,216: OB combined with Fibo area, where the price may adjust to regenerate liquidity before rising.
4,192–4,195: strong low area, where the market has reacted strongly before.
3. Fibo & Price Action
In the current upward move, the price has approached the 0.786 Fibo and encountered resistance at 4,230–4,240. A correction to the 0.382–0.5 area (corresponding to OB 4,200–4,216) would be reasonable before the market continues to retest higher areas.
Notable price action signals:
The consecutive appearance of bullish CHoCH indicates that buying pressure is in control.
The 4,192 low is still protected and acts as an important low of the recovery phase.
If the price retests the OB cleanly, this is a good trigger point for a new upward move.
4. Trading Plan
Preferred Scenario: Buy according to structure
Buy Waiting Area: 4,200–4,216 (OB + Fibo)
Stop Loss: below 4,192
Targets:
4,230–4,240
4,255
4,289–4,290
Confirmation Conditions
The price needs to clearly break the resistance area of 4,230–4,240 to trigger upward momentum.
The retest of the OB must occur with reduced liquidity and a confirming candle pattern.
5. Summary
The market structure shows a short-term upward trend is forming. The price is likely to adjust to the 4,200–4,216 area before continuing upwards to 4,240 and further to 4,255–4,290.
The appropriate strategy is to wait to buy in the OB & Fibo area under the condition of clear confirmation signals.
In the M30 timeframe, the price is in a correction phase after forming a strong bottom area around 4,192–4,195. From there, the market has generated a series of positive signals: the price line gradually moves higher, with consecutive CHoCH appearances, indicating weakening selling pressure and a shift in cash flow towards accumulation.
The resistance area of 4,230–4,240 remains a significant barrier. If it is broken with a clear closing candle, the upward structure will be confirmed, and the price may expand to higher areas.
2. Key Price Areas (SMC Mapping)
Upper Resistance
4,230–4,240: strong reaction area, acting as the first barrier.
4,255–4,256: the next expansion area when the upward trend is confirmed.
4,289–4,290: the final target in the expansion structure of the upward wave.
Support Area – Buying Point
4,200–4,216: OB combined with Fibo area, where the price may adjust to regenerate liquidity before rising.
4,192–4,195: strong low area, where the market has reacted strongly before.
3. Fibo & Price Action
In the current upward move, the price has approached the 0.786 Fibo and encountered resistance at 4,230–4,240. A correction to the 0.382–0.5 area (corresponding to OB 4,200–4,216) would be reasonable before the market continues to retest higher areas.
Notable price action signals:
The consecutive appearance of bullish CHoCH indicates that buying pressure is in control.
The 4,192 low is still protected and acts as an important low of the recovery phase.
If the price retests the OB cleanly, this is a good trigger point for a new upward move.
4. Trading Plan
Preferred Scenario: Buy according to structure
Buy Waiting Area: 4,200–4,216 (OB + Fibo)
Stop Loss: below 4,192
Targets:
4,230–4,240
4,255
4,289–4,290
Confirmation Conditions
The price needs to clearly break the resistance area of 4,230–4,240 to trigger upward momentum.
The retest of the OB must occur with reduced liquidity and a confirming candle pattern.
5. Summary
The market structure shows a short-term upward trend is forming. The price is likely to adjust to the 4,200–4,216 area before continuing upwards to 4,240 and further to 4,255–4,290.
The appropriate strategy is to wait to buy in the OB & Fibo area under the condition of clear confirmation signals.

면책사항
해당 정보와 게시물은 금융, 투자, 트레이딩 또는 기타 유형의 조언이나 권장 사항으로 간주되지 않으며, 트레이딩뷰에서 제공하거나 보증하는 것이 아닙니다. 자세한 내용은 이용 약관을 참조하세요.
면책사항
해당 정보와 게시물은 금융, 투자, 트레이딩 또는 기타 유형의 조언이나 권장 사항으로 간주되지 않으며, 트레이딩뷰에서 제공하거나 보증하는 것이 아닙니다. 자세한 내용은 이용 약관을 참조하세요.