
Day 15 of 90 — Previous Highs Show the Trend
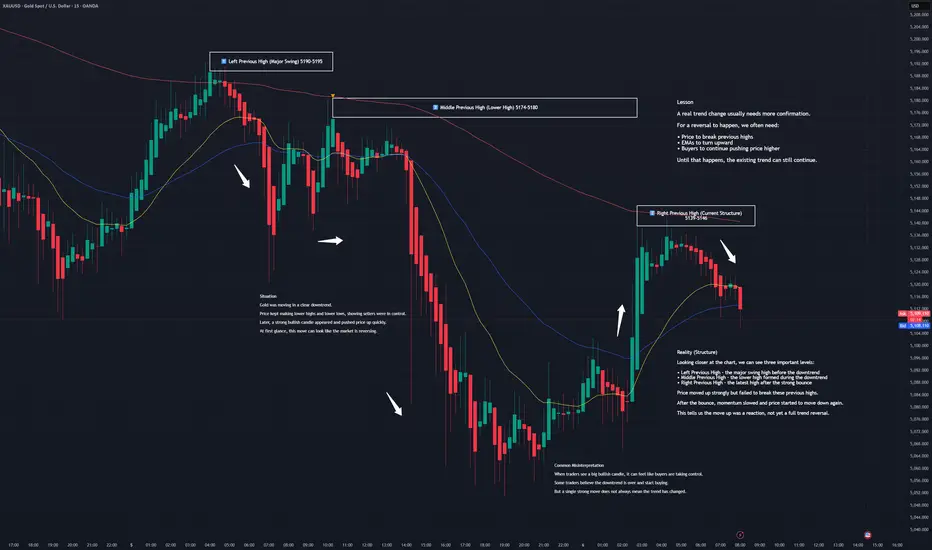
XAUUSD | M15 | Sentinel Lite
Situation
Gold was already moving in a clear downtrend.
Price kept making lower highs and lower lows, showing that sellers were controlling the market.
Later, a strong bullish move pushed price up quickly.
At first glance, this move can make it look like the market is reversing.
Common Misinterpretation
When Traders see a big bullish candle, it can feel like buyers are taking control.
Some traders believe the downtrend is over and start buying.
But a strong move up does not always mean the trend has changed.
Reality (Structure)
Looking closer at the chart, we can see three important levels:
• Left Previous High (Major Swing) — the major high before the downtrend began
• Middle Previous High (Lower High) — a bounce that failed during the downtrend
• Right Previous High (Current Structure) — the latest high after the strong bounce
Price moved up strongly but failed to break these previous highs.
After the bounce, momentum slowed and price started moving down again.
This tells us the move up was a reaction, not yet a full trend reversal.
Lesson
A real trend change usually needs more confirmation.
For a reversal to happen, we often need:
• Price to break the previous highs
• EMAs to turn upward
• Buyers to continue pushing price higher
Until that happens, the existing trend can still continue.
Sentinel Principle
You do not trade every pattern.
You trade aligned conditions.
🛡 Discipline > Impulse
Series Note
This 90-day series is also part of my own learning journey in understanding market structure.
Let’s see how price develops in the next session.
#XAUUSD
#Gold
#PriceAction
#TrendStructure
#TradingEducation
#SentinelCore
#Intraday
#Scalping
#TradingView
XAUUSD | M15 | Sentinel Lite
Situation
Gold was already moving in a clear downtrend.
Price kept making lower highs and lower lows, showing that sellers were controlling the market.
Later, a strong bullish move pushed price up quickly.
At first glance, this move can make it look like the market is reversing.
Common Misinterpretation
When Traders see a big bullish candle, it can feel like buyers are taking control.
Some traders believe the downtrend is over and start buying.
But a strong move up does not always mean the trend has changed.
Reality (Structure)
Looking closer at the chart, we can see three important levels:
• Left Previous High (Major Swing) — the major high before the downtrend began
• Middle Previous High (Lower High) — a bounce that failed during the downtrend
• Right Previous High (Current Structure) — the latest high after the strong bounce
Price moved up strongly but failed to break these previous highs.
After the bounce, momentum slowed and price started moving down again.
This tells us the move up was a reaction, not yet a full trend reversal.
Lesson
A real trend change usually needs more confirmation.
For a reversal to happen, we often need:
• Price to break the previous highs
• EMAs to turn upward
• Buyers to continue pushing price higher
Until that happens, the existing trend can still continue.
Sentinel Principle
You do not trade every pattern.
You trade aligned conditions.
🛡 Discipline > Impulse
Series Note
This 90-day series is also part of my own learning journey in understanding market structure.
Let’s see how price develops in the next session.
#XAUUSD
#Gold
#PriceAction
#TrendStructure
#TradingEducation
#SentinelCore
#Intraday
#Scalping
#TradingView

— Pips0mnian | Precision over prediction
관련 발행물
면책사항
해당 정보와 게시물은 금융, 투자, 트레이딩 또는 기타 유형의 조언이나 권장 사항으로 간주되지 않으며, 트레이딩뷰에서 제공하거나 보증하는 것이 아닙니다. 자세한 내용은 이용 약관을 참조하세요.
— Pips0mnian | Precision over prediction
관련 발행물
면책사항
해당 정보와 게시물은 금융, 투자, 트레이딩 또는 기타 유형의 조언이나 권장 사항으로 간주되지 않으며, 트레이딩뷰에서 제공하거나 보증하는 것이 아닙니다. 자세한 내용은 이용 약관을 참조하세요.