
1. "Bullish Breakout Anticipation: Gold Eyes $3,435 Zone"
This title emphasizes the potential breakout scenario:
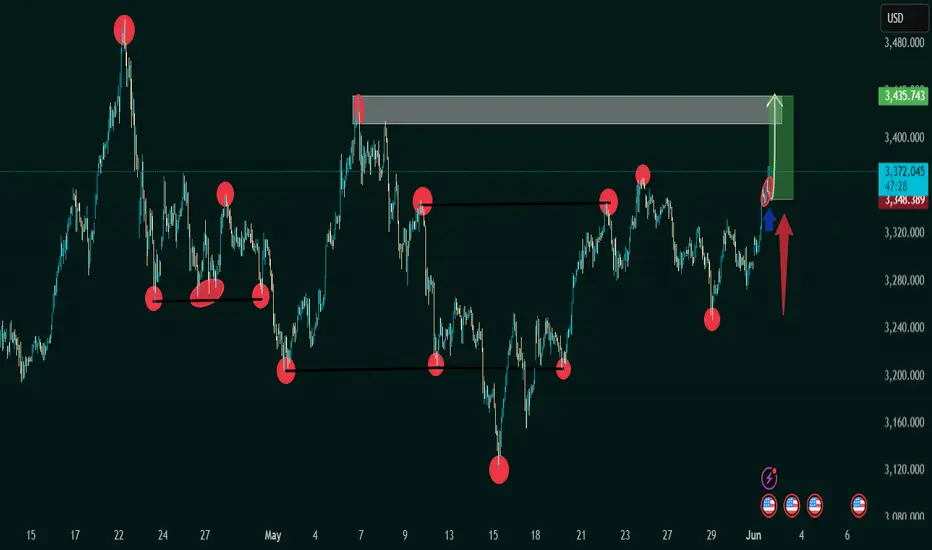
The chart shows price pushing into a previous supply zone (highlighted rectangle).
The green box and arrow indicate a bullish target near $3,435.
Key resistance has been tested multiple times (red circles), suggesting weakening seller control.
📈 2. "Double Bottom Reversal Validates Bullish Momentum in XAU/USD"
This reflects a technical pattern recognition:
A potential double bottom forms near the May 15th and late May lows.
The breakout from the neckline (around $3,350–$3,370) confirms the reversal.
Red-to-green zone suggests the projected move post-breakout.
🔄 3. "Range Consolidation Broken: XAU/USD Breaks Key Resistance"
Focuses on market structure:
Horizontal support/resistance lines indicate a range-bound market.
The recent move above previous highs signals a range breakout.
Blue arrow suggests a retest could offer a long entry point.
💡 4. "Buy Opportunity Triggered on Retest: Targeting Supply Zone Break"
This suits a trading plan scenario:
Red and blue arrows suggest a pullback-and-go trade setup.
The price may revisit the breakout level (~$3,348) before heading higher.
The green zone is the profit target area.
⚔️ 5. "Battle of Supply and Demand: Bulls Gaining Control Above $3,370"
Captures the market sentiment shift:
Multiple failed attempts to break lower (marked with red circles).
Final bullish breakout shows momentum shift to buyers.
If volume confirms, the breakout could be strong and sustained.
This title emphasizes the potential breakout scenario:
The chart shows price pushing into a previous supply zone (highlighted rectangle).
The green box and arrow indicate a bullish target near $3,435.
Key resistance has been tested multiple times (red circles), suggesting weakening seller control.
📈 2. "Double Bottom Reversal Validates Bullish Momentum in XAU/USD"
This reflects a technical pattern recognition:
A potential double bottom forms near the May 15th and late May lows.
The breakout from the neckline (around $3,350–$3,370) confirms the reversal.
Red-to-green zone suggests the projected move post-breakout.
🔄 3. "Range Consolidation Broken: XAU/USD Breaks Key Resistance"
Focuses on market structure:
Horizontal support/resistance lines indicate a range-bound market.
The recent move above previous highs signals a range breakout.
Blue arrow suggests a retest could offer a long entry point.
💡 4. "Buy Opportunity Triggered on Retest: Targeting Supply Zone Break"
This suits a trading plan scenario:
Red and blue arrows suggest a pullback-and-go trade setup.
The price may revisit the breakout level (~$3,348) before heading higher.
The green zone is the profit target area.
⚔️ 5. "Battle of Supply and Demand: Bulls Gaining Control Above $3,370"
Captures the market sentiment shift:
Multiple failed attempts to break lower (marked with red circles).
Final bullish breakout shows momentum shift to buyers.
If volume confirms, the breakout could be strong and sustained.
액티브 트레이드
taede actie 150+ running
관련 발행물
면책사항
해당 정보와 게시물은 금융, 투자, 트레이딩 또는 기타 유형의 조언이나 권장 사항으로 간주되지 않으며, 트레이딩뷰에서 제공하거나 보증하는 것이 아닙니다. 자세한 내용은 이용 약관을 참조하세요.
면책사항
해당 정보와 게시물은 금융, 투자, 트레이딩 또는 기타 유형의 조언이나 권장 사항으로 간주되지 않으며, 트레이딩뷰에서 제공하거나 보증하는 것이 아닙니다. 자세한 내용은 이용 약관을 참조하세요.