
Lets start off with taking a look back at this chart from October 2019:
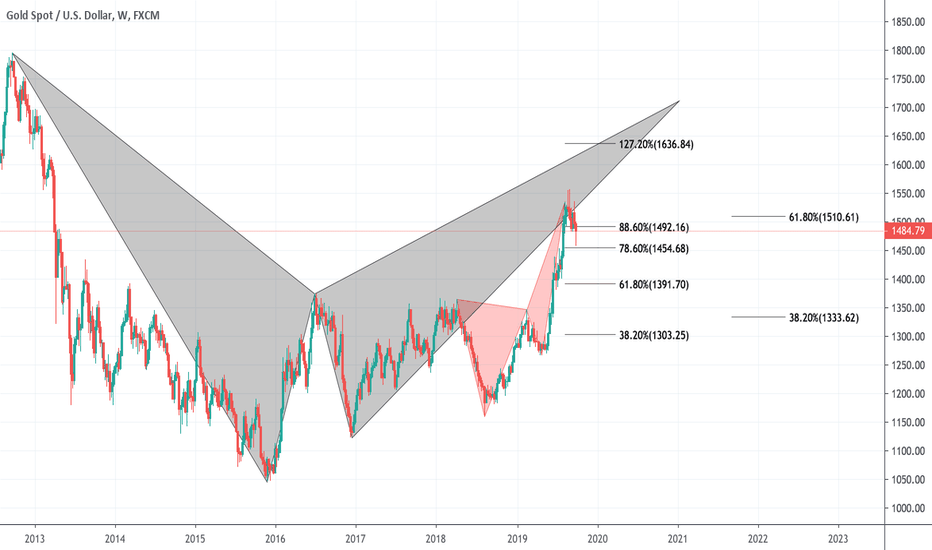
Heres how the weekly chart currenty looks:

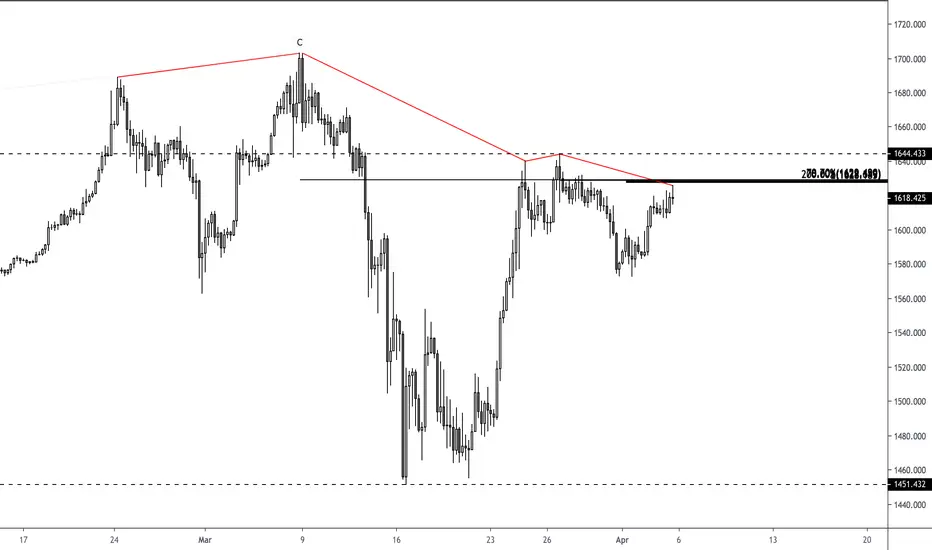
On the 4h timeframe red trendlines highlights both regular and hidden divergences appearing all over this market. ''C'' is a 261.8% extension that was followed by a 15% decline! Considering the huge drop, im expecting this trend to continue and another dip in this market is anticipated.
A trade with stops above the highs targeting the lows would not be a bad idea IMO.
Whats your view on XAU/USD?
Share your comments in the section below
Thank you for reading
Heres how the weekly chart currenty looks:
On the 4h timeframe red trendlines highlights both regular and hidden divergences appearing all over this market. ''C'' is a 261.8% extension that was followed by a 15% decline! Considering the huge drop, im expecting this trend to continue and another dip in this market is anticipated.
A trade with stops above the highs targeting the lows would not be a bad idea IMO.
Whats your view on XAU/USD?
Share your comments in the section below
Thank you for reading
노트
A break below the trendline indicates a shift in momentum:
면책사항
해당 정보와 게시물은 금융, 투자, 트레이딩 또는 기타 유형의 조언이나 권장 사항으로 간주되지 않으며, 트레이딩뷰에서 제공하거나 보증하는 것이 아닙니다. 자세한 내용은 이용 약관을 참조하세요.
면책사항
해당 정보와 게시물은 금융, 투자, 트레이딩 또는 기타 유형의 조언이나 권장 사항으로 간주되지 않으며, 트레이딩뷰에서 제공하거나 보증하는 것이 아닙니다. 자세한 내용은 이용 약관을 참조하세요.