
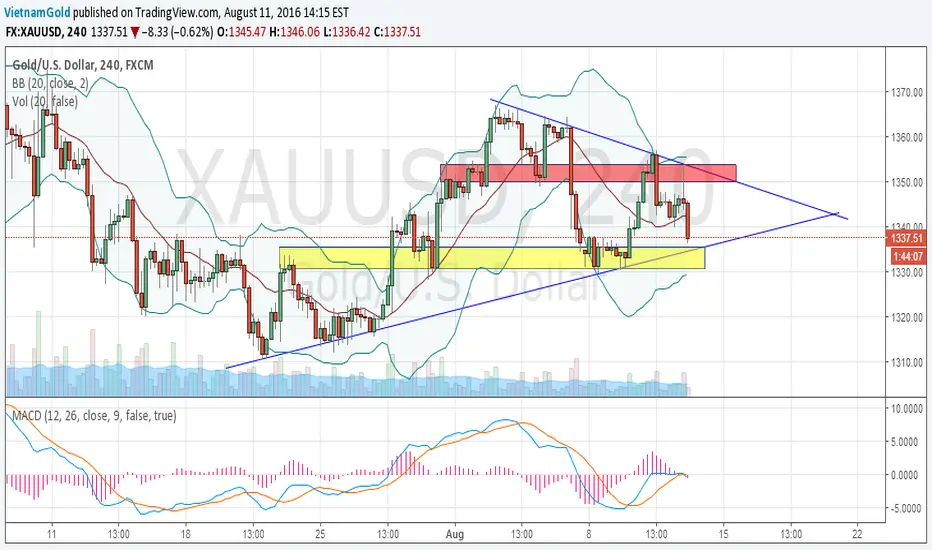
Gold has been in a range 1330-1360 for a couple of days. A triangle pattern can be drawn as chart. A break out of the triangle pattern will signal the next move for gold. Watch the support zone by the support trend line around 1330-1335. A break down of that support area will signal a big move down. Meanwhile, the resistance zone by the resistance trend line is around 1350-1355. A break out of that resistance area will signal a move up. Please note that a triangle pattern is usually a continuation pattern. Therefore I would prefer a move down here since gold is still in a correction phase.
노트
Gold is behaving exactly as charted above, in a triangle pattern, gold found support at 1335 before turning back up to 1355. Again sellers came in a pushed it back to 1333-1335 level. The pattern is due to a break down possibly. This is how I count waves in a triangle pattern. Wave 5 is coming I guess so. And gold might break down to 1310-1320.노트
Gold is still trading within market range, a break out of that triangle pattern is due. I am updating my waves count due to current market situation. Only a close above 1350 will confirm breaking out to the upside. 
관련 발행물
면책사항
해당 정보와 게시물은 금융, 투자, 트레이딩 또는 기타 유형의 조언이나 권장 사항으로 간주되지 않으며, 트레이딩뷰에서 제공하거나 보증하는 것이 아닙니다. 자세한 내용은 이용 약관을 참조하세요.
면책사항
해당 정보와 게시물은 금융, 투자, 트레이딩 또는 기타 유형의 조언이나 권장 사항으로 간주되지 않으며, 트레이딩뷰에서 제공하거나 보증하는 것이 아닙니다. 자세한 내용은 이용 약관을 참조하세요.