
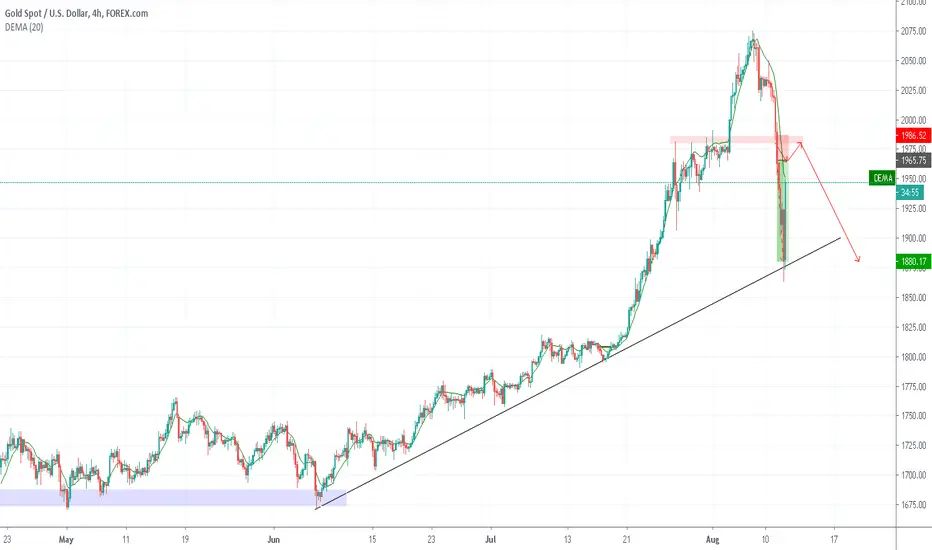
PERFECT TREND YESTERDAY TARGET REACH PROPER HIGHER HIGH
The Perfect Trend Line indicator act as a trend following indicator. It is simply made of 2 lines from highest high and lowest low of 2 different periods, one short and a longer one.
If the price breaches the longest line, it is a sign a of potential trend reversal, while if price is in the cloud made of these 2 lines, it is only a retracement and a potential price rebound in the same direction as the main trend.
Confirmation of trend reversal are highlighted with blue and red dots.
The cloud can be expanded with the SlowPipDisplace and the FastPipDisplace settings which must be set in points/pips values.

면책사항
해당 정보와 게시물은 금융, 투자, 트레이딩 또는 기타 유형의 조언이나 권장 사항으로 간주되지 않으며, 트레이딩뷰에서 제공하거나 보증하는 것이 아닙니다. 자세한 내용은 이용 약관을 참조하세요.
면책사항
해당 정보와 게시물은 금융, 투자, 트레이딩 또는 기타 유형의 조언이나 권장 사항으로 간주되지 않으며, 트레이딩뷰에서 제공하거나 보증하는 것이 아닙니다. 자세한 내용은 이용 약관을 참조하세요.