
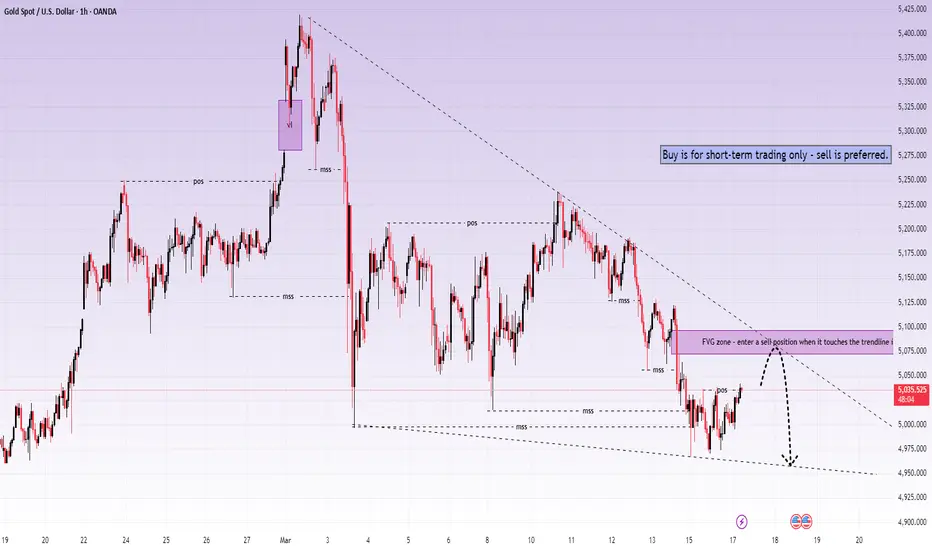
Gold is showing a short-term recovery attempt, but the broader structure still favours sellers. The current rebound looks more like a retest into resistance rather than the start of a stronger bullish reversal.
Fundamental backdrop
This week, the Fed may sound more cautious rather than clearly dovish.
Even if policymakers avoid signalling near-term rate cuts, the market still wants a clearer policy path. That keeps the USD supported, especially if Fed officials continue to resist aggressive easing expectations.
For gold, that creates a mixed backdrop. Safe-haven demand remains supportive in the background, but a firm Dollar is still limiting upside. In the short term, this keeps gold vulnerable to rallies that fail into resistance.
Technical structure on H1
Overall structure
On the H1 chart, XAUUSD remains inside a broader bearish structure after failing to sustain previous recovery attempts. Price is still trading below the descending trendline, which continues to act as the main directional guide.
The recent bounce from the lower range shows that buyers are still active near support, but the recovery is not strong enough yet to shift the overall structure. For now, this looks like a relief bounce inside a bearish trend.
5,070 – 5,090: FVG and trendline resistance
The most important area to watch on the upside is the 5,070 – 5,090 zone.
This area combines:
the FVG resistance
the descending trendline
and a likely sell-entry zone based on the current structure
If price continues to rebound into this area but fails to break through cleanly, the market may form another lower high and resume the downside move.
5,030 – 5,000: Near-term reaction zone
Price is currently trying to stabilise above the 5,030 – 5,000 area after the recent selloff. This zone is acting as short-term support and is allowing a recovery attempt to develop.
As long as the market stays above this region, a retest into the trendline remains possible. But this support is still only temporary unless buyers can reclaim the upper resistance zone.
4,950 – 4,960: Lower support target
If gold rejects from the FVG and trendline resistance, the next downside target sits around 4,950 – 4,960.
This is the lower boundary of the current structure and the main bearish objective if sellers regain control after the rebound.
What order flow is suggesting
Order flow currently suggests that buyers are only creating a short-term bounce, while sellers still hold the broader advantage.
So for now:
buyers are attempting a recovery from the lower range
sellers still control the bigger structure below the descending trendline
and the 5,070 – 5,090 zone remains the key area that may decide whether the rebound fails
This supports the idea that any upside move may be temporary unless price breaks above resistance with stronger momentum.
Trading scenarios
Scenario 1: Rebound into trendline, then sell continuation
If gold continues to recover into 5,070 – 5,090 and shows clear rejection, the market may rotate lower again in line with the bearish structure.
Entry: 5,070 – 5,090 on bearish rejection
SL: above 5,110
TP1: 5,030
TP2: 5,000
TP3: 4,950 – 4,960
Scenario 2: Short-term buy only from current support
If price continues to hold above the current base and buying momentum improves, gold may extend the rebound into the FVG/trendline zone first.
Entry: around 5,020 – 5,030 on bullish confirmation
SL: below 4,995
TP1: 5,070
TP2: 5,090
This is only a short-term recovery setup. The broader bias still favours selling into resistance.
Scenario 3: Breakdown from current range
If gold fails to hold above the current support base and breaks lower before reaching the trendline retest zone, bearish continuation may resume directly.
Entry: below 5,000 on confirmed breakdown
SL: above the broken support
TP1: 4,960
TP2: lower support if selling pressure accelerates
Key levels to watch
5,020 – 5,030 → near-term support
5,070 – 5,090 → FVG + trendline resistance
5,110 → invalidation for the sell setup
4,950 – 4,960 → lower bearish target
Conclusion
Gold may still rebound slightly from current levels, but the broader H1 structure remains bearish while price stays below the descending trendline. The preferred scenario is a recovery into 5,070 – 5,090, followed by renewed selling pressure.
For now, buy is only for short-term trading, while sell remains the preferred direction if price reacts negatively at the trendline resistance.
Follow Lana for more XAUUSD trading ideas and clear technical setups.

관련 발행물
면책사항
해당 정보와 게시물은 금융, 투자, 트레이딩 또는 기타 유형의 조언이나 권장 사항으로 간주되지 않으며, 트레이딩뷰에서 제공하거나 보증하는 것이 아닙니다. 자세한 내용은 이용 약관을 참조하세요.
면책사항
해당 정보와 게시물은 금융, 투자, 트레이딩 또는 기타 유형의 조언이나 권장 사항으로 간주되지 않으며, 트레이딩뷰에서 제공하거나 보증하는 것이 아닙니다. 자세한 내용은 이용 약관을 참조하세요.