
Guys I want to start off by pointing out, that for the last 30 days gold has rallied more then 20%, about 300$ or 3000 pips. Keep this in mind before reading the technicals.
This chart is showing a potential short term trend reversal and signals a trade in the direction of a longer term trend.
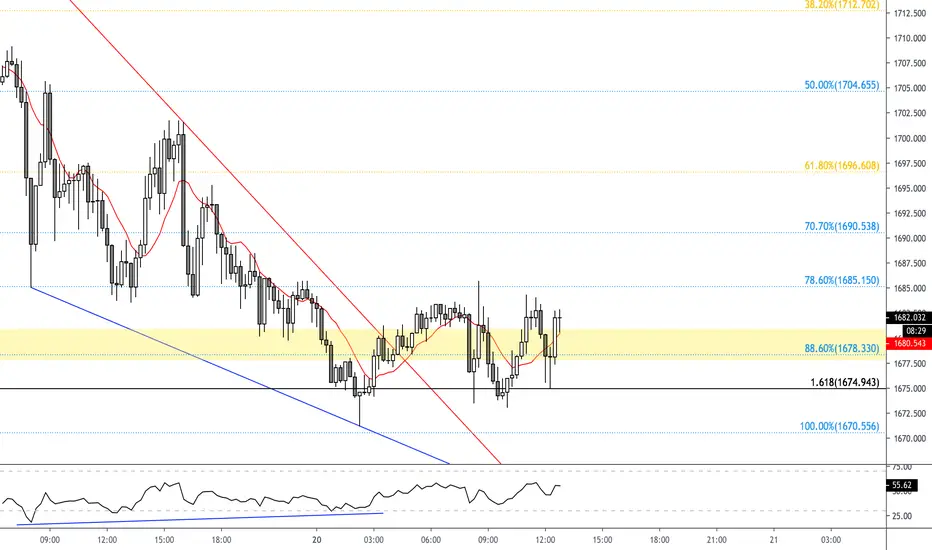
Classic bullish divergence appearing on a chart with price printing lower lows while RSI showing higher highs on a 15 minute chart. Price and momentum starting to converge.
A right angled triangle is drawn on the chart connecting the preceding highs and lows within the divergence, and the triangle appearing as a wedge illustrates support/resistance lines. A break above the resistance signals a shift in bearish momentum.
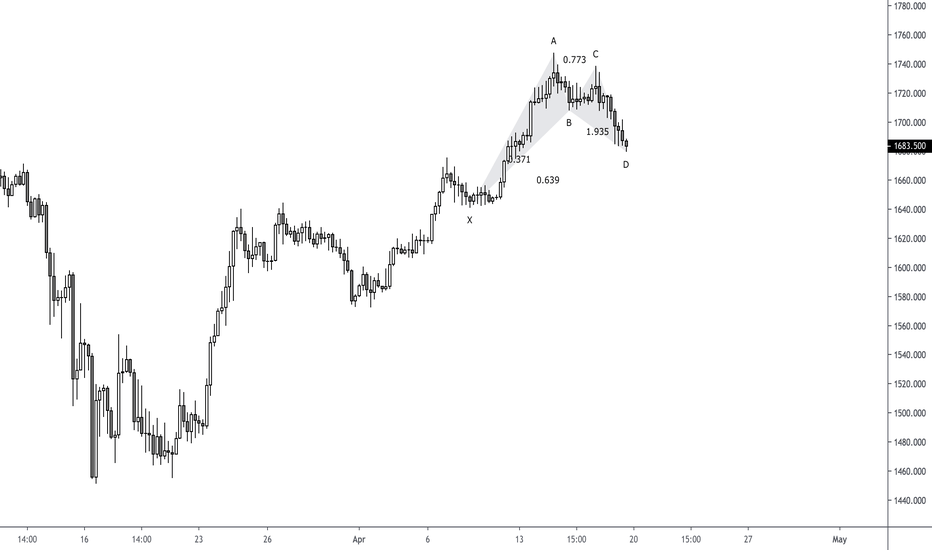
Support has been found with a fibonacci cluster and is now appearing on the chart after the Gartley pattern completion point, which was shared in the previous post:
Thank you for all the likes and comments!
Good luck to all trading gold !!
This chart is showing a potential short term trend reversal and signals a trade in the direction of a longer term trend.
Classic bullish divergence appearing on a chart with price printing lower lows while RSI showing higher highs on a 15 minute chart. Price and momentum starting to converge.
A right angled triangle is drawn on the chart connecting the preceding highs and lows within the divergence, and the triangle appearing as a wedge illustrates support/resistance lines. A break above the resistance signals a shift in bearish momentum.
Support has been found with a fibonacci cluster and is now appearing on the chart after the Gartley pattern completion point, which was shared in the previous post:
Thank you for all the likes and comments!
Good luck to all trading gold !!
노트
Booking some profit here at a 38.2% retracement plotted as 61.8% on the chart
면책사항
해당 정보와 게시물은 금융, 투자, 트레이딩 또는 기타 유형의 조언이나 권장 사항으로 간주되지 않으며, 트레이딩뷰에서 제공하거나 보증하는 것이 아닙니다. 자세한 내용은 이용 약관을 참조하세요.
면책사항
해당 정보와 게시물은 금융, 투자, 트레이딩 또는 기타 유형의 조언이나 권장 사항으로 간주되지 않으며, 트레이딩뷰에서 제공하거나 보증하는 것이 아닙니다. 자세한 내용은 이용 약관을 참조하세요.